Python in Excel
For the Real World
🎉 New! Learn Python in Excel Today
🎉 New! Learn Python in Excel Today
Learn Python in Excel
A step-by-step course that shows you how to apply Python inside Excel so you can solve real data challenges faster, with fewer steps and more control
Python in Excel is Power
No coding experience? No problem.
If you’ve used an IF statement, you’re ready for this.
Learn how to:
Python in Excel is a must-have for serious analysts.
This course is your shortcut.


The course is incredible. The topics are superb, and I found some real “gems” that truly surprised me.
Leila’s explanations are very clear; I enjoyed every single video.
With these tools, my analysis toolbox has reached a new level, and I’m very grateful for that.
My reports are not only faster, but they also deliver more value, making it easier for managers to make better decisions.
Most Python in Excel tutorials show you how to redo what Excel already does.
This course shows you what Excel can’t do – and how Python makes it easy.
If you’ve ever built a chart in Excel and thought,
“This looks okay, but I’m not really seeing the full picture”
you’re not alone.
Excel gives you formulas, charts, and slicers. But:
That’s where Excel falls short.
And where Python steps in.
Let me show you the difference Python in Excel makes:
Before
After
No idea what Python in Excel can actually do, so you stay quiet in meetings
Confidently suggest Python when it’s the better tool
Charts that look nice but say little
Visuals that reveal trends Excel charts miss
Manually scanning for what looks “off”
Python flags outliers in seconds
Manually fixing messy dates
One line of Python cleans entire columns
Copy-pasting from CSVs and creating reports
Create charts from external data — no imports, smaller files
Static charts with fixed formatting
Charts that change (even color, axis, or type), based on cell values
Reshaping data with multiple steps
Reformat columns or group data in one line
No clue how Python fits into your work
Learn a modern skill used across tools and industries
Soon you’ll be saying:
I used to spend hours formatting data and tweaking charts. Now it takes minutes – and I actually understand what’s going on in the data.
That’s the power of knowing when to use Python, and how to use it inside Excel.


I wanted a smoother, smarter way to automate and analyze data from one place.
The course helped me to build automated dashboards and beautiful charts much faster, saving hours every week and impressing collaborators with cleaner, smarter reports.
I feel confident using Python!
— David Maghene, Small Business Owner
Python skills are great for any data analyst. Especially in today’s job market.
Sometimes learning is not about immediate action, but understanding what’s possible so you can actively participate in conversations around new tools.
🛡️ Think of it as career insurance.
In today’s job market, even basic Python skills set you apart.
While others rely on outdated workflows, you’ll know the faster, smarter way forward.


This course was super easy to follow and really well structured. I like that I can go back and find specific topics when I need a refresher.
I’m excited to use the tools I just learned. I’ve spent quite a bit of time in the past visualizing data, and it can get pretty complex and bogged down.
Now, with Python, not only will I be able to make this process easier, but I can also expand on it!
— Angela Selimi, Accountant
You’ll learn how to create clean, modern visuals that help you spot trends, compare data, and catch outliers – even the kind Excel’s built-in charts can’t show.
Absolutely fantastic! By merging the two charts, I was able to gain a much clearer understanding of the information.
This approach truly made all the difference! :)
Use simple Python code (right inside Excel) to reshape columns, clean messy data, or run advanced analysis – no extra tools or imports required.
One day, and the course has already paid for itself. How awesome is that!
Our friendly teaching assistants are ready to help you whenever you feel stuck.


The course is well constructed, offers tons of support, and provides the links to the different libraries and how to use them.
The ability to go at your own pace helps a lot for someone like me with a full-time, 10-hour workday.
I thought Python in Excel would be difficult to learn. However, Leila is such a great instructor. No one should be disappointed.
When should you use Power Query, Python, or native Excel?
You’ll learn how to combine them, and when to keep it simple. This way you can work faster and avoid overcomplicating your files.


My hesitation before joining the course was that I wouldn’t fully understand everything, but it was well broken down and taught in a way that I could keep up and build my confidence.
Get lifetime access, bonuses, and all future updates.
Join 2,500+ learners like you
Self-Paced Course
One payment. Lifetime access.
Total Value
Everything you need to master Python in Excel. Plus:
These are real, job-ready skills you’ll build step by step:
Python in Excel Basics
Combine Python with your Excel skills for smarter workflows
(Value: $97)
Python Basics
Learn core Python without leaving Excel. Apply it outside too
(Value: $89)
Advanced Data Analysis
Group, filter, and reshape your data with speed
(Value: $119)
Advanced Visuals
Smarter charts that are beyond Excel’s standard capabilities
(Value: $89)
Forecasting & Time Series
Spot trends and use forecasting models to predict what’s next
(Value: $99)
Machine Learning
Build and apply Machine Learning models in Excel
(Value: $112)
And that’s just the core training.
To make this even more powerful, you’ll also get three exclusive bonuses:
Power Query vs Python
Learn when to use Python or Power Query for your workflow
(Value: $72)
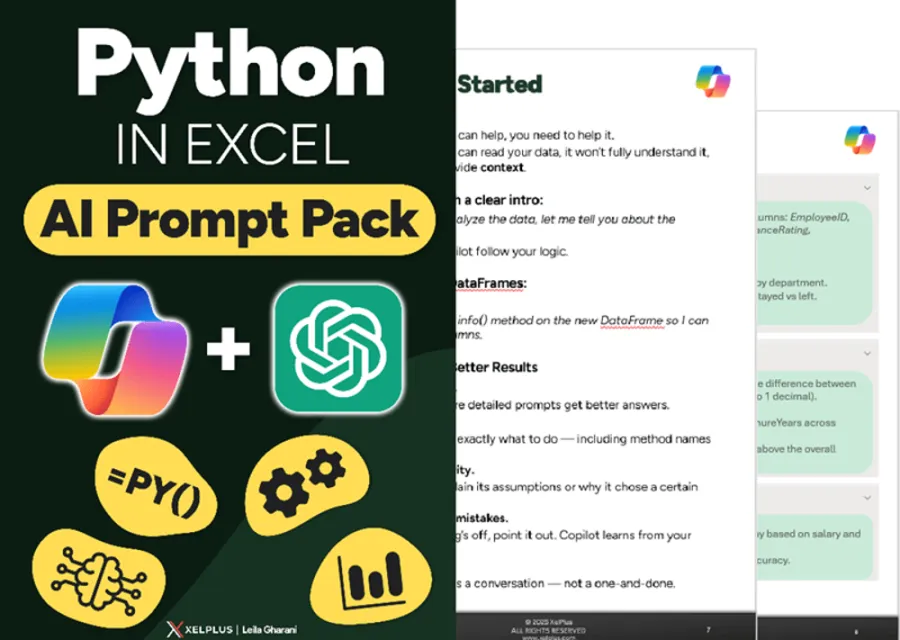
Copilot & ChatGPT Prompt Pack
Write better Python faster using AI-generated prompts
(Value: $79)
The Copy-Paste Code Book
Every code snippet from the course, ready to reuse
(Value: $79)
When you add up all the core skills and bonuses, the total course value comes to $835.
You get all this for just $379.


This course really delivered on covering a wide range of topics. The variety kept things interesting, and I appreciated how each topic built on the previous ones.
Learning time series forecasting and machine learning has been a game-changer for my analytical capabilities.
The data cleaning techniques are going to be huge for me, especially dealing with messy date formats.
I can’t wait to start applying the principles I’ve picked up in this course to give our organization a serious competitive edge.
Definitely recommend for anyone looking to expand their analytical toolkit.


The XelPlus team is supportive and responsive whenever difficulties arise.
Thanks to the course, I can now share more advanced analyses and reports.
— Solène, Resources Manager


The course is an eye-opener to the world of possibilities available through the combined use of Excel, Power Query, and Python in Excel for data prep, analyses, and efficient workflows.
— Espen Hauge, Analyst
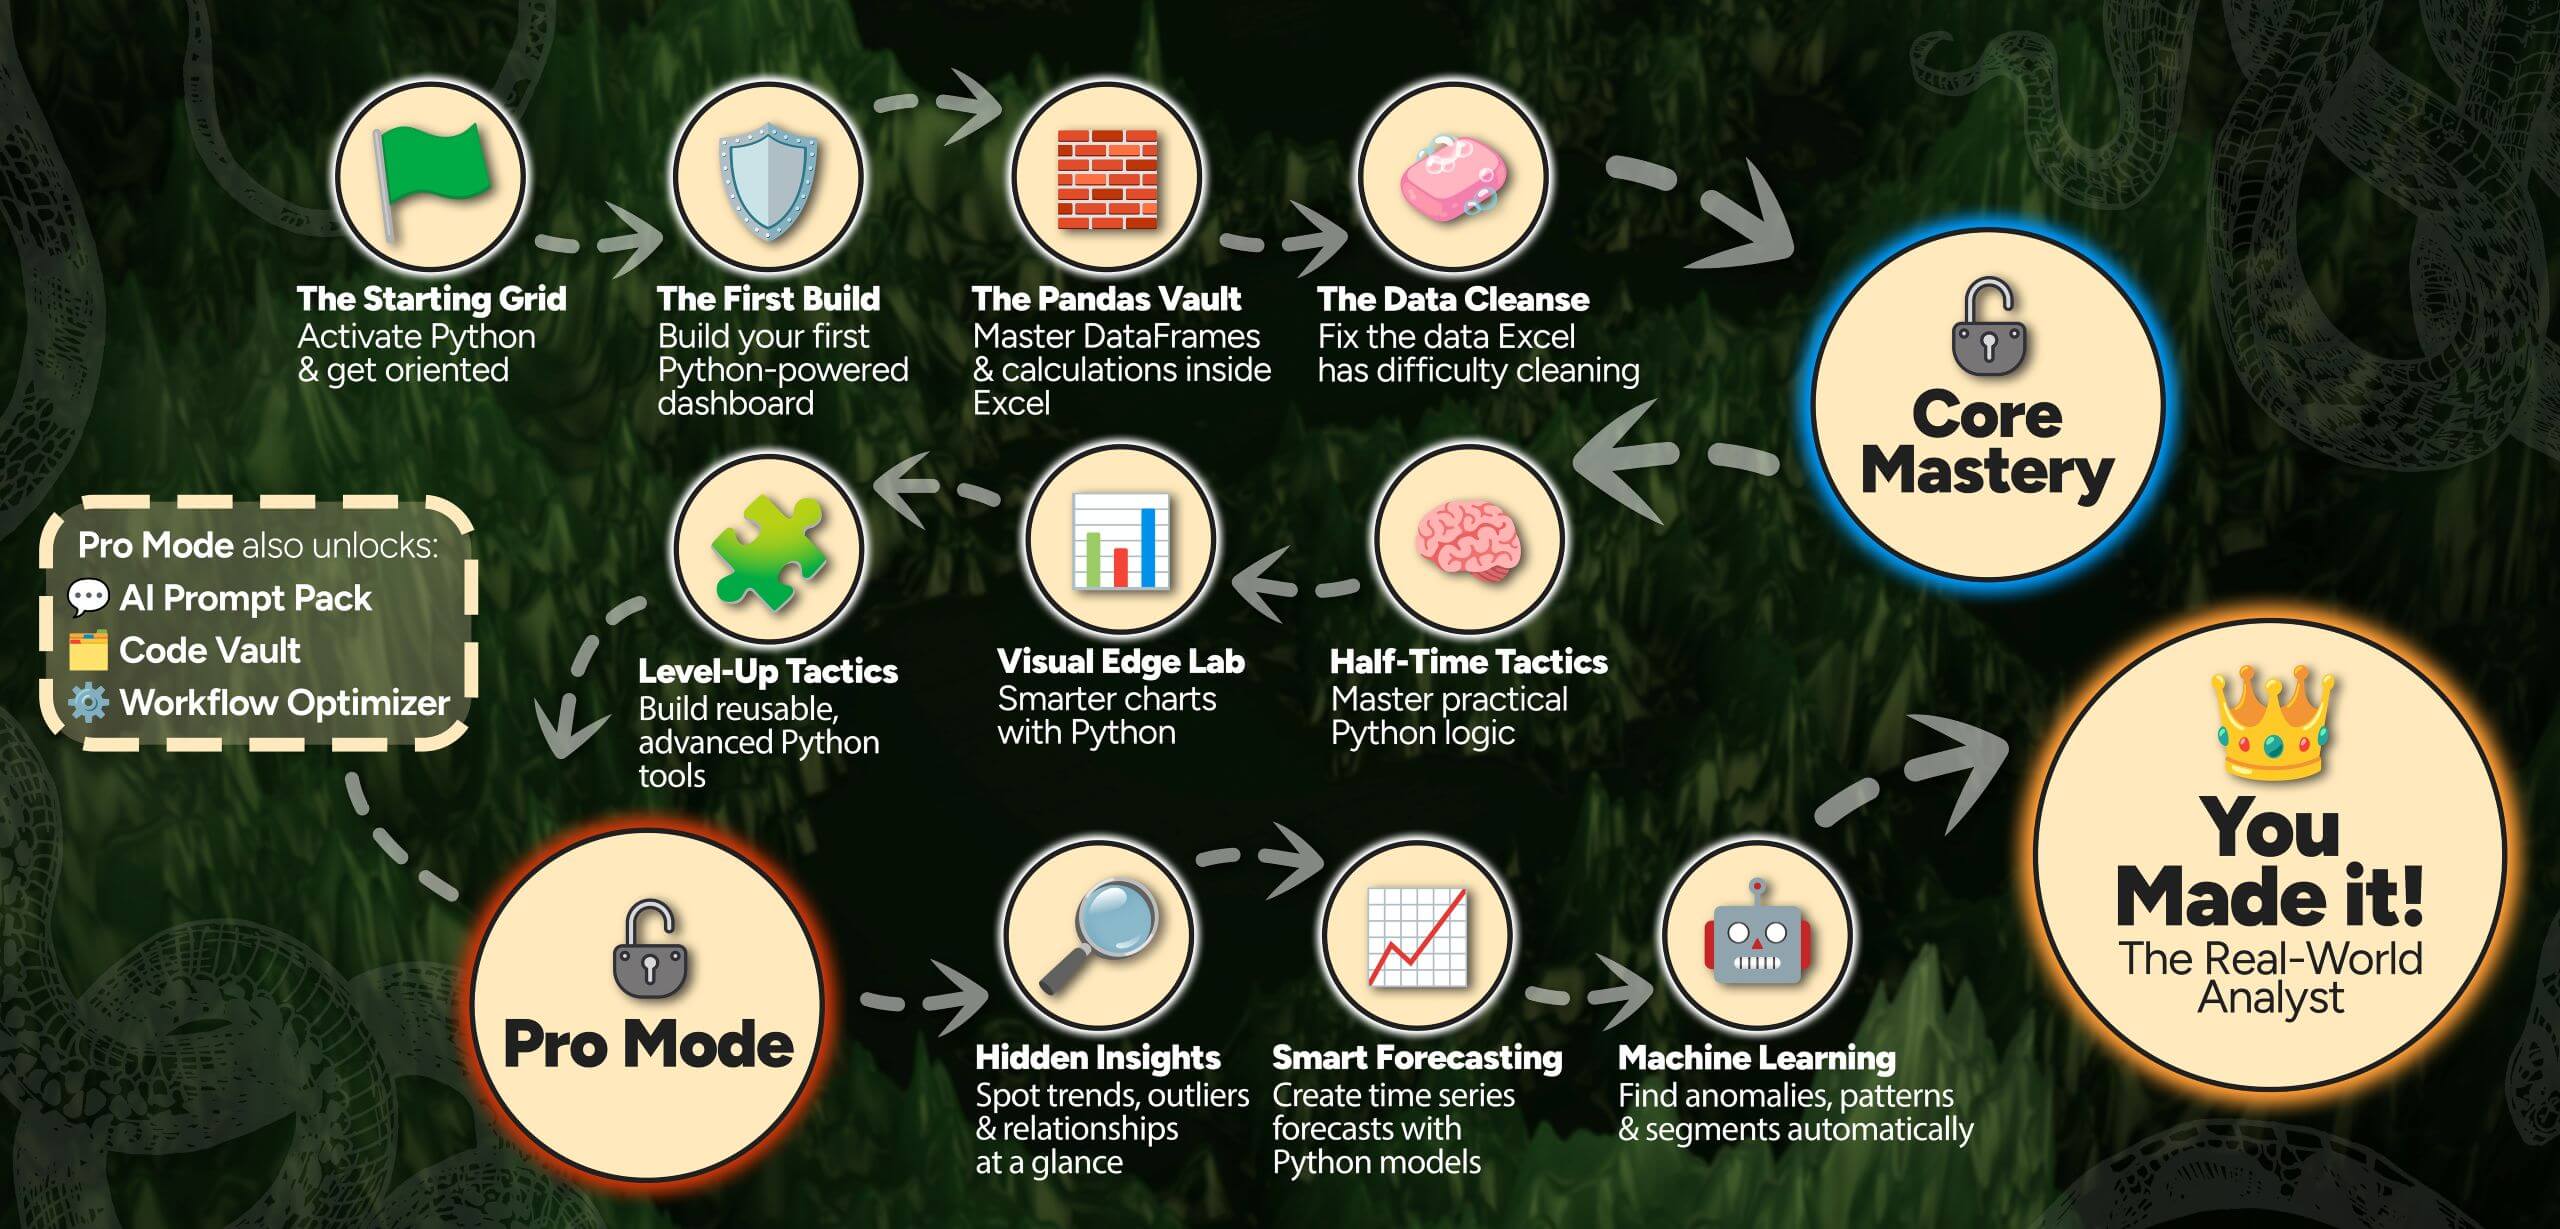
Below is an overview of the course modules.
This guided path takes you from Python newbie to using it for real business wins. You’ll learn Python in Excel, and you won’t need to become a programmer to get there.

Thousands of professionals just like you have transformed their careers with our courses.
And the best part? You’ll see results right from the first module.
Still unsure? Here’s why this course is unlike any other:
Ready to Level Up Your Excel Skills?
Python in Excel is a game changer – and now’s the time to master it.
In minutes, you’ll turn messy data into clear insights. You’ll save hours and get the recognition you deserve at work.


I took the course to develop myself and to learn a new skill. I tried learning Python before, but I do not have any computer programming experience and struggled with the terms and language the instructors use.
As usual, Leila explained it in a way that I could understand and follow. I particularly love the way she shows where and how to obtain more documentation on the different subjects.
I learned a new skill that is totally out of my profession and comfort zone.
After 15 years in corporate and 10 years consulting and teaching clients, I know the pain points of working with data and multiple spreadsheets.
Not only do you have to be fast with your analysis, but you also need to be confident in your results. Let’s not forget, it has to be mistake-free and well-presented.
That’s exactly where Python in Excel comes in. It’s a powerful way to clean, analyze, and visualize your data — with fewer steps and better results.
Whether you’re brand new to Python or just curious how it fits inside Excel, I’ll help you apply it in a practical, simple way — just like I’ve helped thousands of others do.
– Leila


Join the course and start using Python in Excel the smart way
These extras are included with your course. They’ll save you hours of trial and error.
BONUS 01

When to Use Python vs Power Query
Not sure which tool to pick for cleaning up data?


This quick guide shows you exactly when Python gives you more power. And when Power Query is the faster, simpler option.
(Value: $72)
AI Prompt Pack
Properly use CoPilot & ChatGPT
This bonus shows you how to use AI to write, explain, and fix Python code
Download your Prompt Pack, with ready-to-use examples to discover what’s possible
(Value: $79)
BONUS 02

BONUS 03
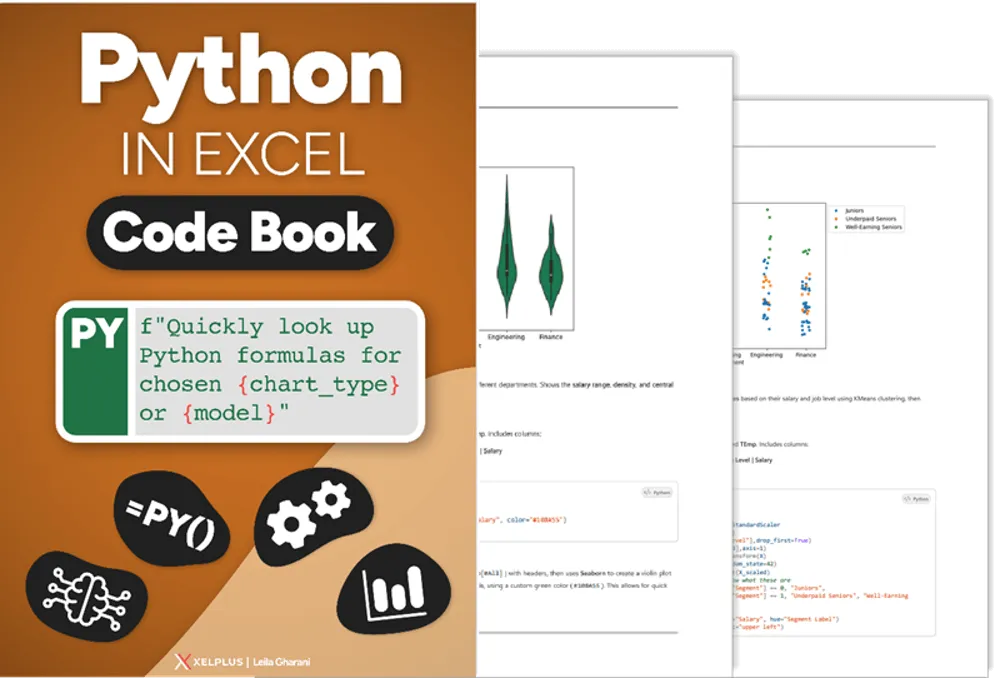

The Copy-Paste Code Book
Every snippet from the course, organized by topic.
Easily find what you need without digging through videos. And use it as a cheat sheet at work.
(Value: $79)
Note: Bonuses are available 3 weeks after enrollment
We include this in every course, because it helps the learning stick:
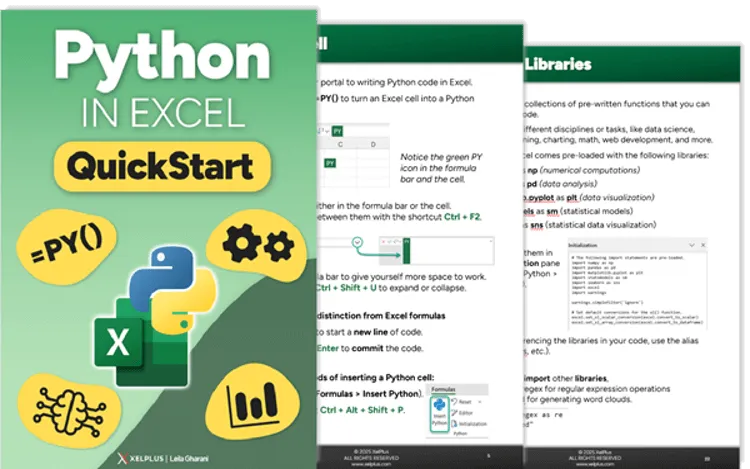
QuickStart Guide + Key Takeaways
We take the notes for you, so you don’t have to stress. Great addition to help you better learn Python in Excel.
The QuickStart guide includes everything you need to hit the ground running
The Key Takeaways help you quickly review what matters, so you don’t forget a thing
(No extra charge. It’s just part of how we teach.)
A LITTLE EXTRA

This course isn’t about writing code for the sake of it.
It’s about using simple Python inside Excel to solve real problems with fewer steps.
By the end, you’ll know how to:
Create visuals that reveal trends, differences, and outliers Excel can’t show.
Run advanced analysis even without needing to load external data in your sheets.
Clean messy data and reshape columns using one line of code.
Build dynamic reports that respond to dropdowns, change chart types, and even update based on values in your cells — all without VBA.
Decide when to use Excel, Power Query, or Python.
Speed up your work using templates, shortcuts, and even AI (like Copilot and ChatGPT).
Feel confident using Python in a practical way.
I’ve come across comments like this on social media:
This course is too expensive. I’ll just learn it from YouTube or ask ChatGPT.
My response?
You should use those tools. I do too!
But they’re a complement to structured learning, not a replacement.
They don’t show you what questions to ask. Or what roadblocks you’ll run into once you start using Python in Excel.
That’s what this course is built to do.
Python in Excel is new
Learn Python in Excel from someone who’s taught thousands of professionals the skills they never thought they could master. And who knows what actually matters in a corporate workflow.
Our Course
Their Course
Built to show where Python beats Excel (not copy it)


Start with real wins, not boring theory
Helps you understand what AI tools are doing (and fix it)
Lifetime access to all videos, files, and downloads
Future updates included. No extra payment needed
Get help when you’re stuck. Teaching assistants included
This course wasn’t built to give you surface-level skills.
It’s designed to give you clarity. To be in the loop of the latest developments and be able to contribute to conversations.
What about AI? Because Python in Excel is new, AI doesn’t fully know how it works. It suggests things that sound right, but just don’t work in Excel.
This course is right for you, if you’re someone who sees learning as investment.
Don’t compare cost to cost.
Compare cost to payback.
What will this knowledge let you do?
What could it unlock in your career?
What direction might it take you that you never saw coming?
That’s the kind of ROI you can’t measure in a discount.


The course does an excellent job building up concepts progressively.
Even though the material is dense, you begin to grasp Python’s true power, especially when enhanced by AI tools, while still working in the comfortable Excel environment you already know.
Made a great chart analyzing natural gas storage data from the EIA and having it be flexible with different years.
I feel like I have the next generation data exploration for data analysis.
We don’t teach Python like a programming course.
We teach it like a tool, for people who work in Excel every day.
Here’s how it works:
No installations. No switching apps.
You’ll work right inside Excel, where you’re already comfortable.
This isn’t “Hello World.”
You’ll build dashboards, fix messy exports, and analyze real data from day one.
You’ll use Python for things Excel can’t handle – like anomaly detection, custom chart formatting, or trend analysis, with just a few clear lines.
Excel? Power Query? Python?
We show you how to pick the right tool for the job — and why it matters.
Use Copilot. Copy code. Drop in templates.
This course is a time-saver!
These lessons weren’t generated by AI.
They came from real-world experience. From years of teaching professionals how to solve problems with Excel.
This is built for professionals that use Excel, with a clear path to learn Python in Excel.
Along the way, you’ll pick up new advanced analysis techniques that will set you apart from your peers. And yes, you’ll learn Python too! Plus it will be a ton of fun.


Use Python in Excel to clean data, spot outliers, and create smarter charts – while mastering advanced analysis and knowing when Python adds value.
Course Highlights:
10 hours of video lessons that walk you through real examples
60+ practice files & templates so you can apply what you learn
Real-life scenarios you can use in your work
Bonus 1: Power Query vs Python so you know when to use each
Bonus 2: Copilot + ChatGPT prompt pack to write better Python, faster
Lifetime Access to all content, bonuses, and future updates
English Closed Captions professionally written for clear understanding
Direct Support from our expert teaching assistants
CPD Credits for professional development
Completion certificate & digital badge to show what you’ve learned
We cover a lot in our courses. No more scrubbing through videos to find the answer.
With the built-in Lesson Transporter, you can jump straight to any topic or technique in seconds.
We’ve pulled out every key lesson, timestamped it, and linked it — so when you’re stuck, you can get straight to what matters.
Just click, and you’re there.
Fast answers. Real productivity.
Python in Excel has never been easier to navigate.

📛 You’ve done the work. Now prove it.
After finishing the course, you’ll earn a Python in Excel certificate badge, powered by Credly — trusted by top companies around the world.
It proves you can clean messy data in one step, build reports that respond to inputs, and use Python to solve real Excel problems faster.
You can add your badge to your LinkedIn, resume, or email signature in seconds. It shows you’ve got skills most Excel users don’t.
✅ Stand out. Get noticed. Get hired.
You’ll now earn 10 CPD credits when you complete this course.
That means you can grow your Excel and Python skills and meet your professional development goals — at the same time.
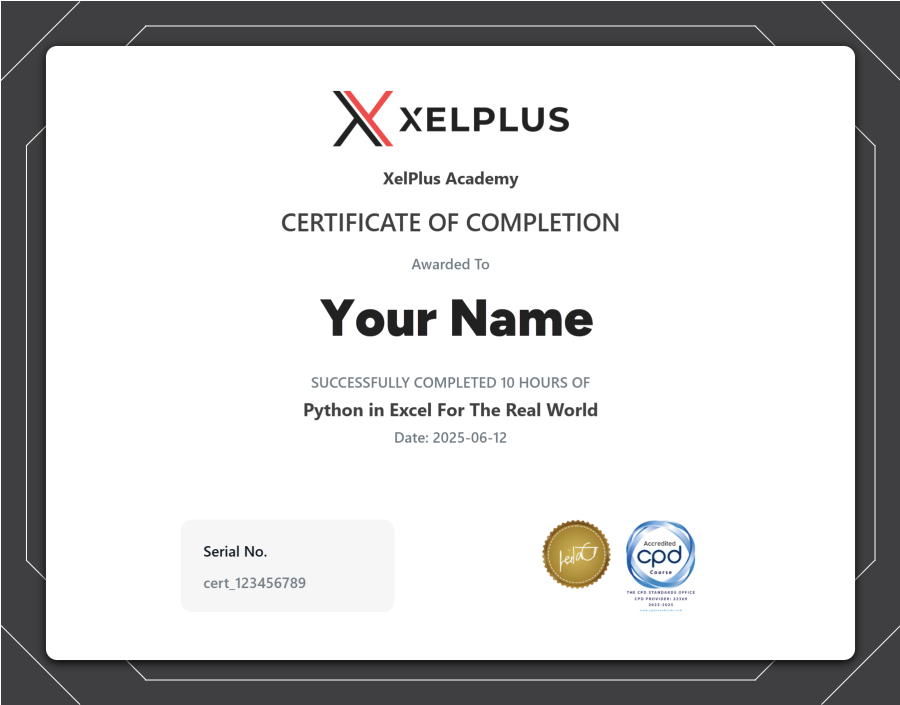
This course is officially certified by the CPD Standards Office, trusted by companies and institutions worldwide.
You’ll receive a certificate with the official CPD seal — proof that your learning counts toward your career.
If you’re looking to grow your skills and earn recognized credit along the way, this course delivers both.


Complete the course and earn your official certificate of completion — with your name, the course title, and CPD accreditation.

It’s perfect to:
It’s proof that you didn’t just start — you finished.
And now you’ve got the skills to back it up.
Join the course to get started


Excellent and comprehensive course on Python in Excel. I certainly learnt new skills that will be useful in the data analysis side of my job.
I learnt awesome new visualisations and thought the machine learning was fascinating.
The course has inspired me to learn more about Pandas and Python in general.
This course is right for you if you use Excel a lot and you’re serious about leveling up.
You’ve heard about Python in Excel but you’re not exactly sure what it does or whether it’s worth learning.
Just to be clear, you don’t need any programming experience. Not even Python basics:
You’re confident with your Excel skills, but you’ve hit limits that slow you down.
You’ve seen Python in Excel, but aren’t sure if it’s for you, or what it really adds.
You’ve tried learning Python before and got stuck in setup, syntax, or too many options.
You work in analysis, reporting, or operations and want to simplify the messy parts of your workflow.
You’re not trying to become a developer. You just want to solve real problems faster and more clearly.
Even if you don’t plan to use Python every day, this course shows you where it makes a difference. And how to use it inside the tool you already know: Excel.
If Excel is your main tool, this course gives you an edge.
Not because you have to use Python. But because you’ll finally know when you should.


I wanted to learn Python before. I had tried a couple of courses as well, but since I’ve been using Excel for more than 10 years, I was very uncomfortable changing the dynamics of my thought process. But this course is really relatable.
I can now use Python in my day-to-day work too. I do see lots of scope to improve my skills and prepare for the future world.
Everyone should do this course.
Still on the fence? That’s completely normal.
We want you to feel confident signing up – so we offer a 14-day no-questions-asked guarantee.
Join the course, try the lessons, download the materials.
If you’re not happy, just email us within 14 days. We’ll refund you — no pressure, no hassle.
You’ve got nothing to lose.
And a powerful new skill set to gain.


Great course for anyone looking to expand beyond Excel and Power Query. It introduced Python in a practical, accessible way, showing how it can be used for data analysis, automation, and even machine learning.
I’ve already started experimenting with Python in Excel to streamline some reporting tasks. It’s helped me think differently about how I approach data problems and opened up new ways to automate and analyze complex datasets.
No programming background needed. If you’ve used Excel formulas before, you’ll be fine.
You’ll learn a few simple Python commands — and use them inside Excel, just like you use functions today.
Only for data – not files, emails, or websites. Python in Excel is great for visualizing and analyzing data — right inside your spreadsheet.
But it can’t send emails, scrape websites directly (you’ll have to use Power Query), or automate across apps like Power Automate or full Python can. That’s why this course focuses on data analysis.
Not at all. This course is for Excel users — not developers. You won’t build apps or write scripts. You’ll solve real problems using short, clear Python code that’s easy to understand (and reuse). Once you learn Python in Excel and see what’s possible, you’ll be shocked to discover that you’ve gained some solid Python skills too!
That’s exactly who this course is for. You’ll learn by doing — inside Excel — with real data, smart visuals, and practical examples. If you’ve ever felt stuck using formulas, you’ll love how simple Python can be.
It replaces parts of VBA — but not all of it. Python in Excel is great for working with data: cleaning, reshaping, creating charts, even customizing them with colors, axes, and drop-downs. So if you’ve used VBA for that — Python might be a better, simpler option.
But if you use VBA to automate emails, move files, or control other apps — Python in Excel won’t help with that. It’s built for data analysis, not full automation. Think of it as a powerful upgrade to how you work with data — inside Excel.
Python has a big overlap with Excel AND Power Query. But it can also do things neither of them can.
If you are importing external data via Power Query, then yes, you can and in fact should clean up the data with Power Query. Then you can go ahead and use Python on the query result.
There are are some cases where cleaning with Python might be more desirable. We cover that in the bonus section of the course.
We want you to be happy with your purchase – and we’re confident you’ll learn something new in every single lecture.
But if you’re not satisfied for any reason, just let us know within 14 days, and we’ll give you a full refund. No questions asked.
Contact us at info@xelplus.com and we will get back to you.