A Data Model in Excel helps you combine data from multiple tables into one place. This makes it easier to create PivotTables and PivotCharts.
When you use Excel Modeling, it appears as a list of tables, but you might not even notice it’s there. An Excel Model works behind the scenes to organize your data, so you can focus on analysis.
Here are some important tips when working with a Data Model in Excel.
Tip 1: Copy Your Data Model Easily
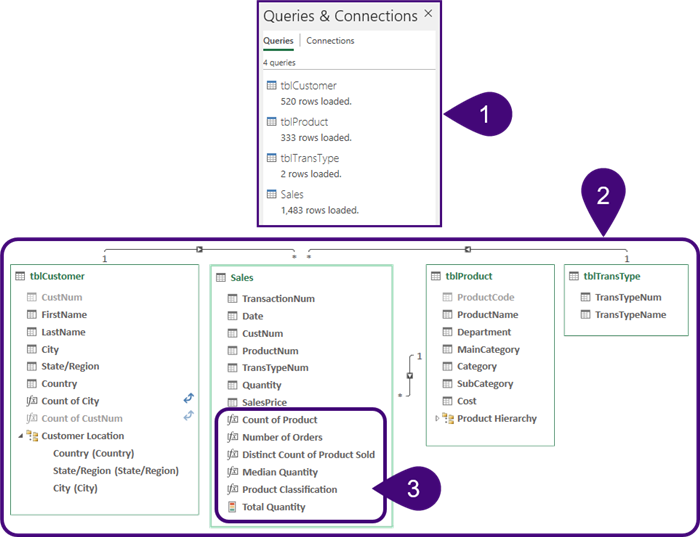
Let’s say you’re working with an Excel file that has the following configuration:
- You imported data tables using Power Query.
- You built a Data Model with relationships between the tables.
- You created DAX Measures and KPIs to help with calculations.

Want to copy your Data Model from one Excel file to another? Here’s a quick method to save you time.
Steps to Copy Your Data Model
- Open Your Existing File: Make sure your file has data tables from Power Query, a Data Model with table relationships, and DAX Measures and KPIs.

- Create a Dummy Pivot Table:
- Insert a new worksheet.
- Start a new Pivot Table using your Data Model.
- Add at least one field from each table in your Data Model to the Pivot Table.
- This connects all elements of your Data Model.

We have created our “dummy “ Pivot Table.

- Copy the Pivot Table:
- Highlight the entire Pivot Table.
- Press
Ctrl+Cto copy it.
- Paste into New Workbook:
- Open a new Excel workbook.
- Press
Ctrl+Vto paste the Pivot Table.
Now, your new workbook contains everything from the original: Power Query queries, Data Model, table relationships, Measures, KPIs, and more.
By following these four simple steps, you avoid the hassle of manually reconstructing your data. This method can save you hours of work.
Featured Course
Excel Data Modeling with Power Pivot & DAX


Tip 2: Create a Dedicated Measures Table
When working with DAX Measures in Power Pivot, you can place Measures in any table. But many users prefer to keep all Measures in one dedicated table.
Why Use a Dedicated Measures Table?
- Organization: Keep all Measures in one place.
- Clarity: Makes finding and managing Measures easier.
How to Create a Dedicated Measures Table
Here’s how you can create a dedicated Measures Table in Excel:
- Start a New Workbook:
- Copy cell A1 (leave it empty).
- Open a new workbook in Excel.
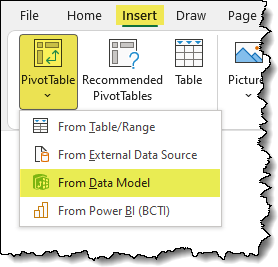
- Open the Data Model:
- Go to the Data tab.
- Click Data Tools, then Data Model.
- Create the Measures Table:
- Click OK.
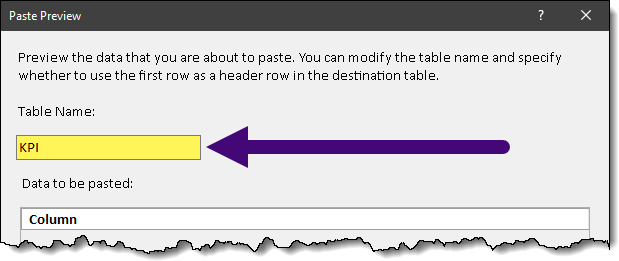
- In the Power Pivot window, click Paste.
- In the Paste Preview window, name the new table (e.g., “KPI”).

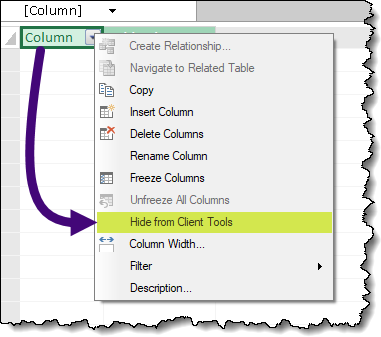
- Hide the Empty Column:
- Right-click the new table’s column heading.
- Select “Hide from Client Tools”.

- Import Your Data:
- Close the Power Pivot window.
- Import your data tables using Power Query or direct import.
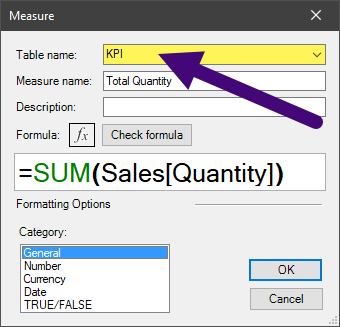
Now, when you create new Measures, they will default to the dedicated Measures Table you created.

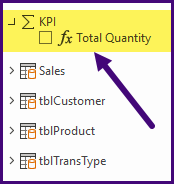
When you create a Pivot Table from the Data Model, you will see the Measures table with an attractive SUM symbol beside the table name. This was created when we hid the empty column from the Client Tools.

❗ If you use Web Services like “Q&A” or “Quick Insights,” having all Measures in one table might cause issues. For regular use, a single Measures Table helps with organization and clarity.
By following these steps, you can keep your DAX Measures neatly organized, making your Excel data models easier to manage.
Featured Bundle
Power Excel Bundle


Tip 3: Use Cube Functions for Flexible Reporting
Want to reference a specific value from a Pivot Table in your dashboard?
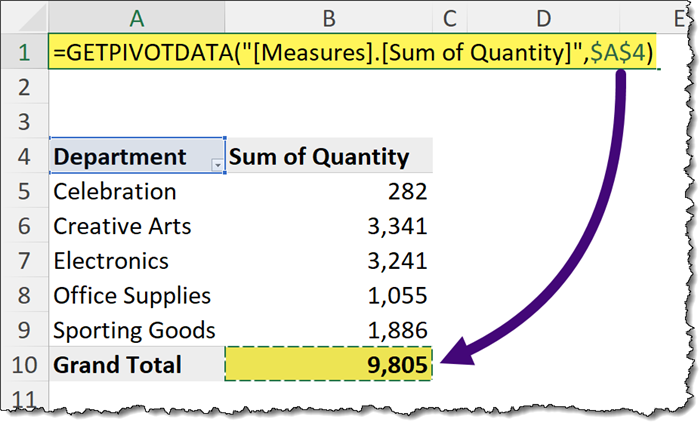

Instead of using the GETPIVOTDATA function, try using Cube functions for more flexibility.
What Are Excel Cube Functions?
Excel Cube functions are a set of functions that allow you to extract and display data from a data model in a flexible way. They are particularly useful for creating dynamic and robust reports that are not tied to the structure of a Pivot Table.
Why Use Cube Functions?
- Stability: Unlike GETPIVOTDATA, Cube functions don’t break when the Pivot Table’s structure changes.
- Flexibility: Show values independently from the Pivot Table.
How to Use Excel Cube Functions:
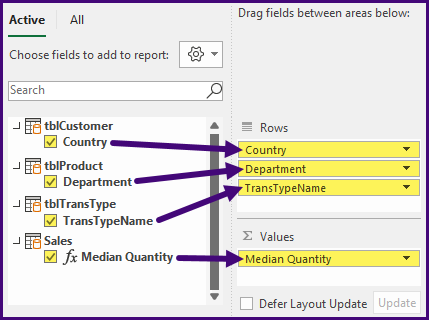
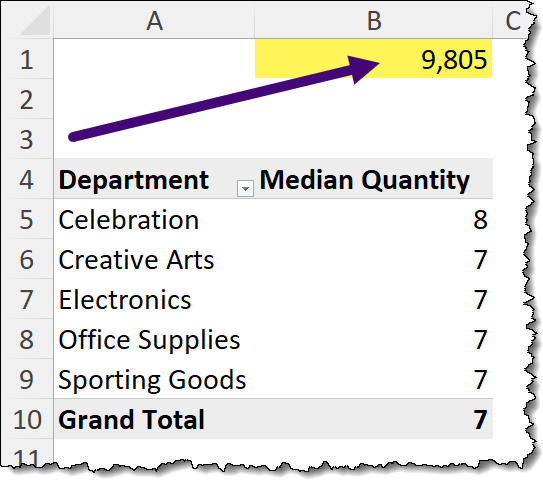
- Create a Pivot Table:
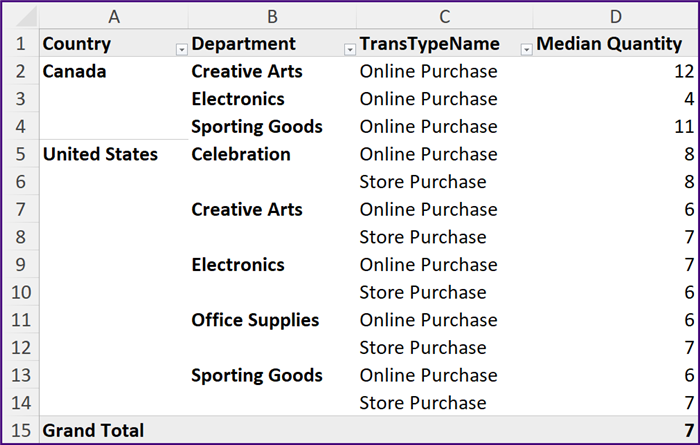
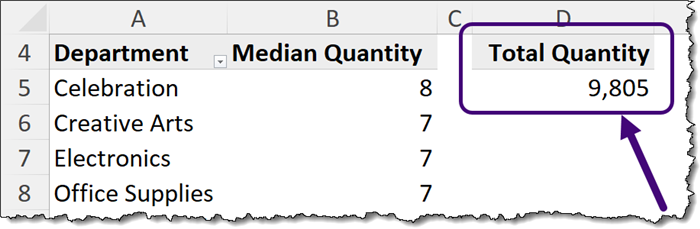
- Build a Pivot Table with the values you need (e.g., total quantity).

- Convert to Cube Functions:
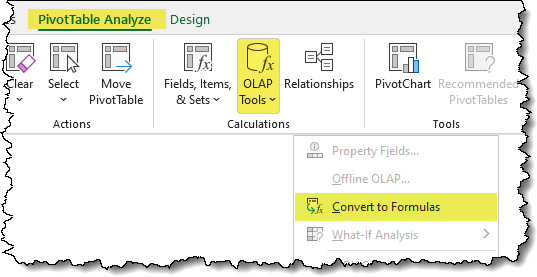
- Select your Pivot Table.
- Go to Pivot Table Analyze tab -> Calculations group -> OLAP Tools -> Convert to Formulas.
- Your Pivot Table cells will change to Cube functions..

- Your Pivot Table cells will change to Cube functions..
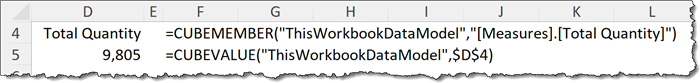

- Combine Cube Functions:
- If one Cube function depends on another, combine them.
- Replace the cell reference D4 in the CUBEVALUE function with the full CUBEMEMBER function..


- Shorten the formula by removing the “CUBEMEMBER(“ThisWorkbookDataModel”,” portion of the formula.
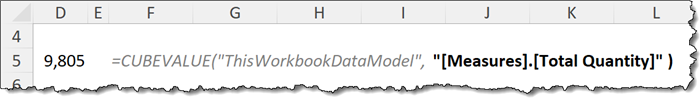

- The result of the CUBE function will refresh whenever the Data Model is refreshed.

Customize the Output of the CUBE Function
- Add a label to your Cube function:
="Total Quantity: " & CUBEVALUE("ThisWorkbookDataModel", "[Measures].[Total Quantity]")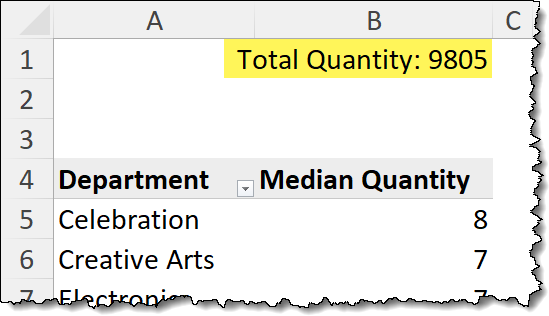

- Format the result with the TEXT function:
="Total Quantity: " & TEXT(CUBEVALUE("ThisWorkbookDataModel", "[Measures].[Total Quantity]"), "#,##0")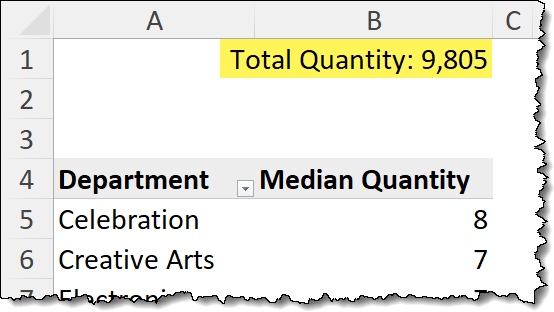

By following these steps, you can create a flexible, robust report that won’t break when your Pivot Table changes. Use Cube functions for better, more reliable data presentation in your dashboards.
Featured Bundle
Black Belt Excel Bundle


Leila Gharani
I’ve spent over 20 years helping businesses use data to improve their results. I've worked as an economist and a consultant. I spent 12 years in corporate roles across finance, operations, and IT—managing SAP and Oracle projects.
As a 7-time Microsoft MVP, I have deep knowledge of tools like Excel and Power BI.
I love making complex tech topics easy to understand. There’s nothing better than helping someone realize they can do it themselves. I’m always learning new things too and finding better ways to help others succeed.