What is a Power BI Slicer
A Power BI slicer helps you filter your data. It is a visual tool in Power BI reports. With slicers, you choose what values to show. They are simple to set up.
This article will show you how to add different types of Power BI slicers.
When to Use a Power BI Slicer
Power BI slicers are useful in various scenarios to enhance your reports. Here are key reasons to use slicers:
- Display Important Filters: Show commonly used or critical filters on the report canvas for easy access.
- Visible Filter States: Make it easy to see the current filter state without needing to open drop-down lists.
- Filter Hidden Columns: Use slicers to filter by columns that are hidden and not directly needed in your data tables.
- Create Focused Reports: Place slicers next to key visuals to create more targeted and focused reports.

Learn Power BI in 1 Hour – 💪 Start Now!
In JUST 60 Minutes, you can create your first Power BI report. Start NOW and see how easy it can be. (1 Month Access).
12982 students enrolled
Last updated Oct 16th, 2025
Please note: No credit card information is required to sign up. If you don’t have an account with our Teachable XelPlus Academy you will need to create one.
Button Slicers
Button Power BI slicers are excellent for slicing data, especially on touchscreen devices like tablets and smartphones. They offer easy selection and deselection, making them a popular choice.

How to Create Button Slicers
- Add a Slicer Visual: Start by adding a slicer visual to your report.
- Populate the Field: Fill the slicer with the desired data model item.

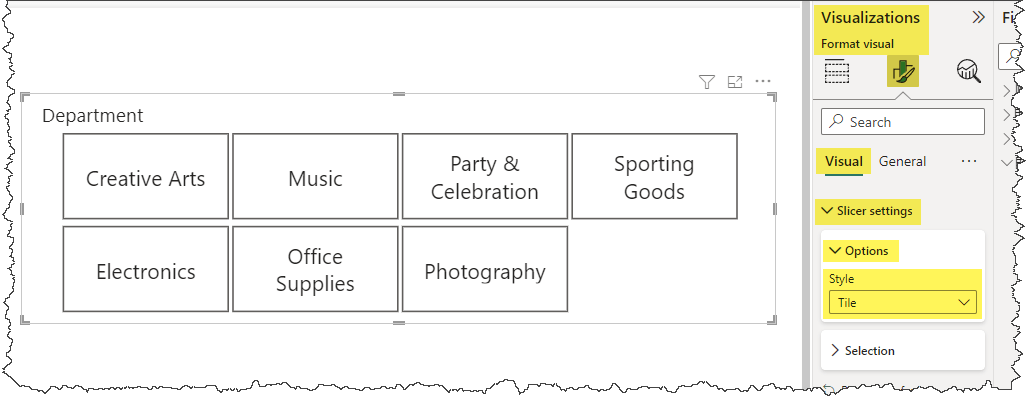
Change to Button Style:
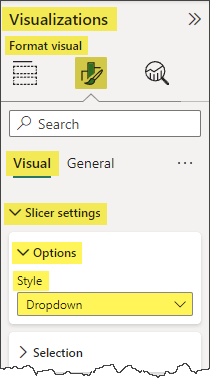
- Go to Visualizations.
- Select Format Visual.
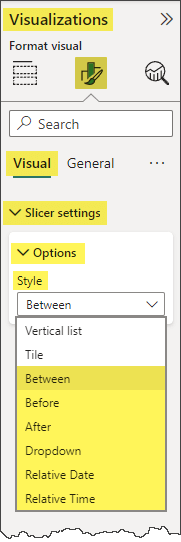
- Navigate to Slicer Settings -> Options -> Style.
- Change the setting to Tile.
Responsive Button Layout
Button slicers are responsive:
- Tall Slicers: Buttons stack on top of each other.
- Wide Slicers: Buttons appear side-by-side.
Selection Options
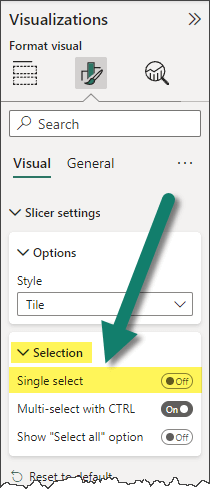
- Multi-select with Ctrl: Hold the Ctrl button to select multiple buttons.
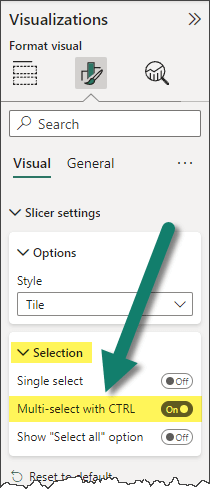
- Single Select: Enable this to allow only one button to be selected at a time.
Customization Options
Customize your button slicers with:
- Heading Display
- Background Color
- Border Color
- Button Color
- Button Border Color and Thickness
- Standard Font Controls
💡 For clear differentiation, match the color of unselected buttons to the background. This helps users easily identify selected versus unselected buttons.
List & Hierarchy Slicers
Power BI slicers offer flexible options to filter your data. This guide covers List Slicers and Hierarchy Slicers, detailing their uses and customizations.
List Slicers
The default slicer style in Power BI is the List.
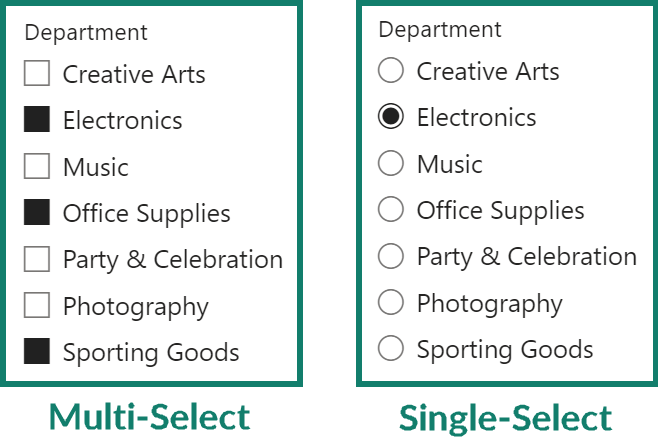
Users can select multiple values using the Ctrl key, or set the slicer to toggle or single select, similar to Button Slicers.
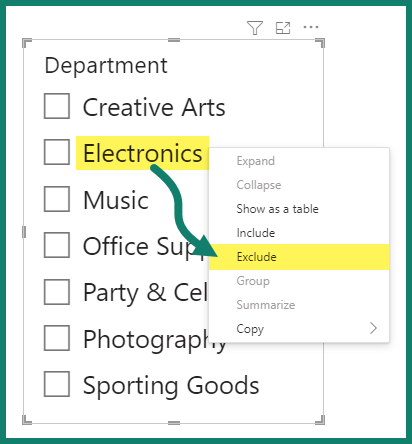
Excluding Items From a List Slicer
If a Slicer contains an item that you wish not to be filtered, you can easily remove the items from the list without any fancy custom Measures.
- Right-Click Exclude: To exclude an item, right-click it in the slicer and select Exclude.
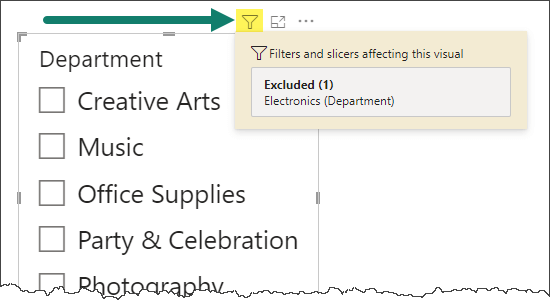
- View Excluded Items: Hover over the “Applied Filters” icon to see excluded items.
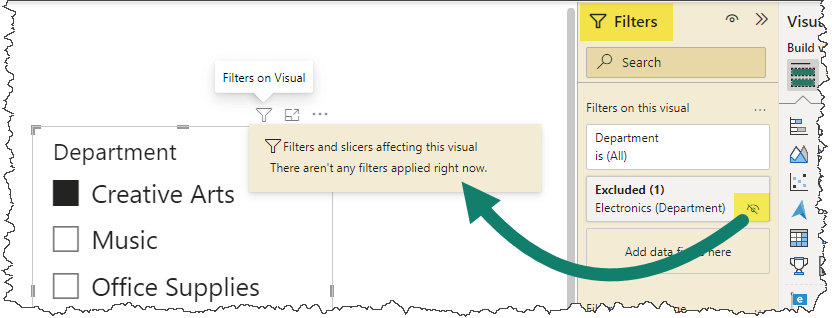
- Hide Excluded Items: Go to the Filters panel and click the eye icon next to the excluded item to hide it completely.
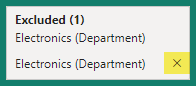
- Reinstate Items: Click the “X” next to the excluded item to reinstate it.
Hierarchy Slicers
Hierarchy slicers allow you to present data in a hierarchical structure without needing to predefine a hierarchy in the Data Model.
Creating a Hierarchy Slicer
- Add Multiple Fields: Add multiple fields to the slicer to create a hierarchy.
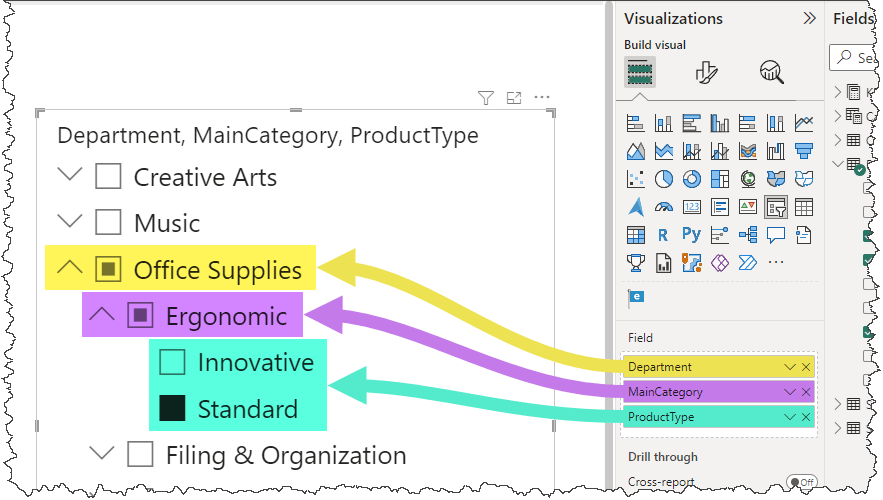
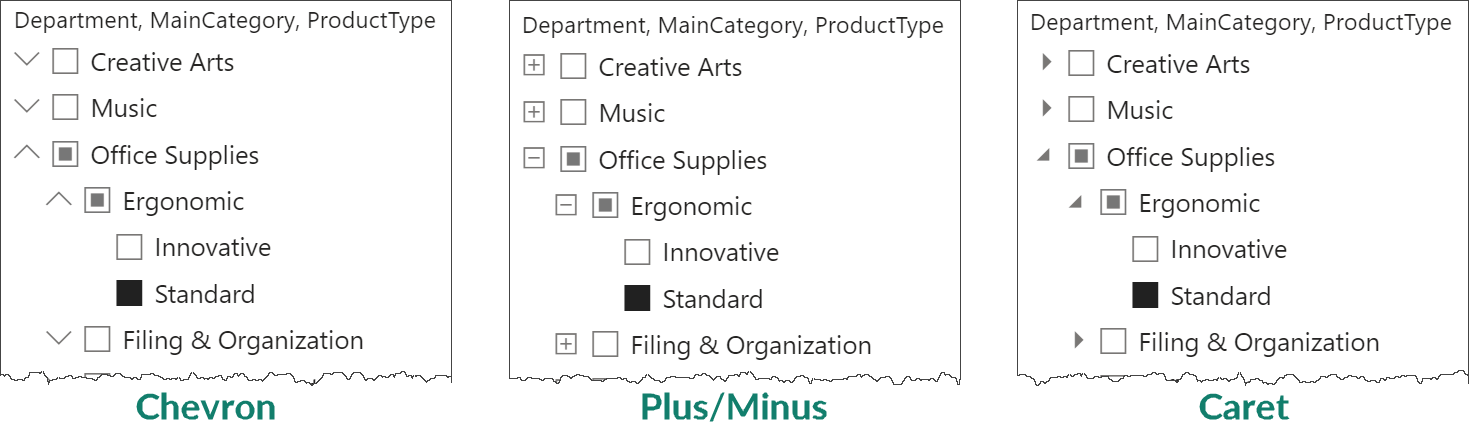
- Expand/Collapse Controls: Use the hierarchy options to control the expansion and collapsing of data levels.
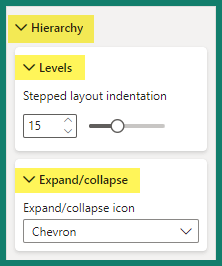
- Indentation Depth: Adjust the indentation depth in the hierarchy options.
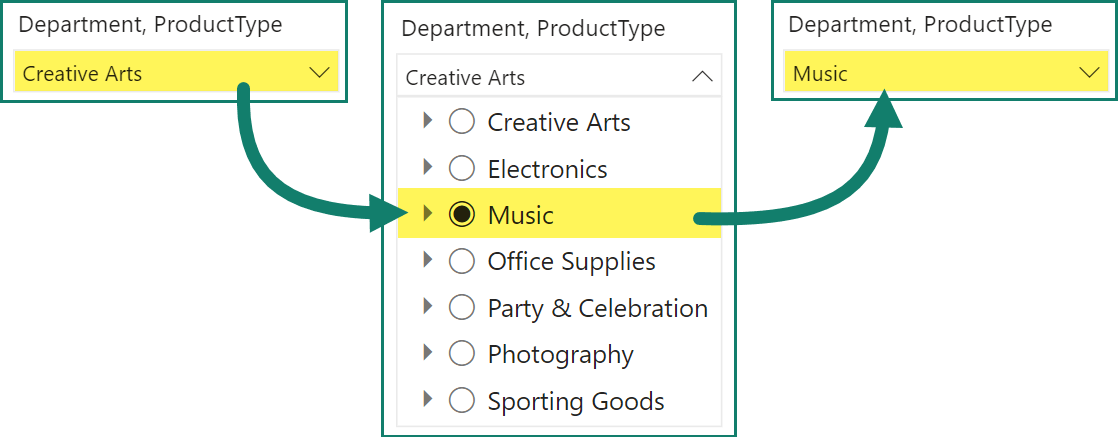
Dropdown Slicers
Dropdown Power BI slicers are perfect for saving space and are ideal for single-select options. Here’s how to use and customize dropdown slicers to enhance your Power BI reports.
Benefits of Dropdown Slicers
- Space-Saving: Dropdown slicers save space on your report canvas, making them ideal for compact layouts.
- Single-Select Option: Great for scenarios where only one selection is needed, helping to simplify user choices.
How to Create a Dropdown Slicer
- Add a Slicer Visual: Start by adding a slicer visual to your Power BI report.
- Change to Dropdown Style:
- Go to Slicer Settings.
- Navigate to Options.
- Select Style and change it to Dropdown.
Featured Course
Fast Track to Power BI

Numeric Range Slicers
Numeric Range slicers are essential for filtering data based on numeric ranges. Here’s how to use them effectively.
Benefits of Numeric (Range) Slicers
Range slicers allow you to:
- Filter data greater than a set value.
- Filter data less than a set value.
- Filter data between two set values.
How to Create a Numeric (Range) Slicer
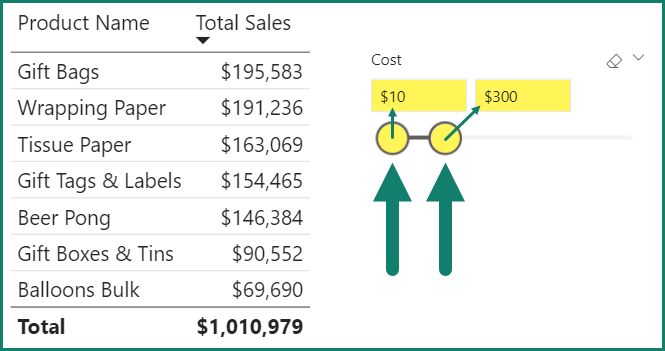
For example, suppose we have a table showing the total sales for all products in our “Party” department.
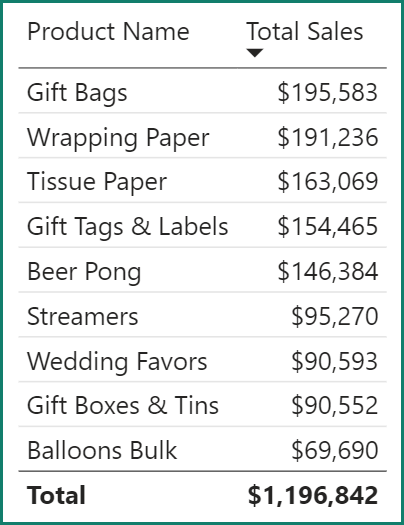
We’d like to see total sales for products that are below a certain cost.
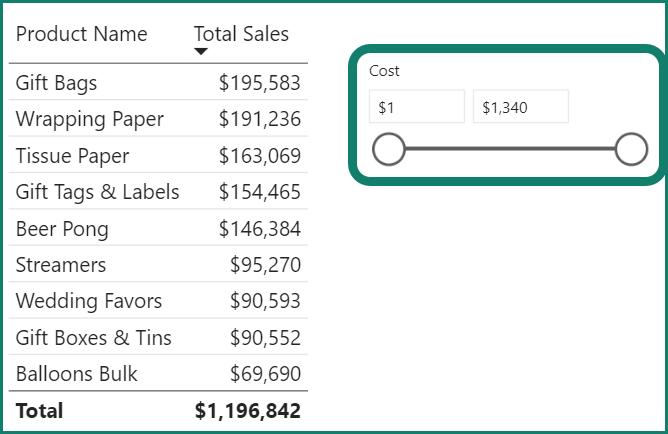
- Add a Slicer Visual: Start by adding a slicer visual to your report.
- Select Numeric Field: Use a numeric field, like “Cost,” from your data model. This will automatically present a range slider.
Customizing the Range Slicer
- Adjusting the Range: Use the two circular handles to set the desired range between the lowest and highest values.
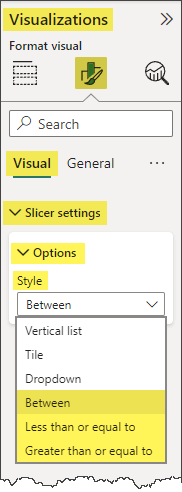
- Changing Range Logic:
- Select the range slicer.
- Go to the slicer’s formatting controls.
- Navigate to Slicer Settings and alter the Style option.
Power Bi Date Slicer
Date range or timeline slicers in Power BI allow you to filter data based on date ranges. Here’s how to use and customize timeline slicers effectively.
Benefits of Timeline Slicers
Timeline slicers let you:
- Filter data greater than a set date.
- Filter data less than a set date.
- Filter data between two set dates.
- Filter data relative to a set date window.
- Filter data relative to a set time window.
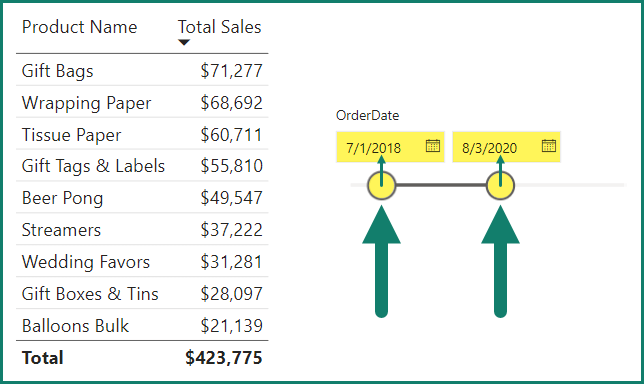
How to Create a Date Range Slicer
- Add a Slicer Visual: Start by adding a slicer visual to your report.
- Select Date Field: Use a date field from your data model.
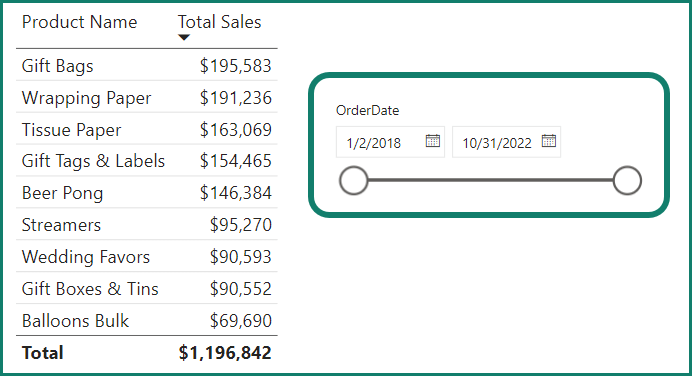
Customizing the Timeline Slicer
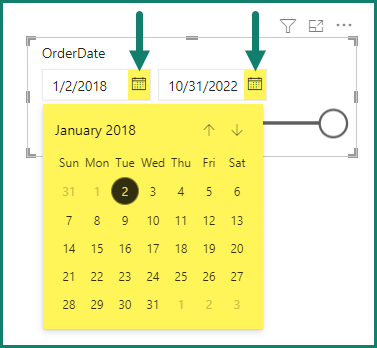
- Adjusting Date Ranges: Set the start and end dates using the range slider.
- Calendar Picker: Use the calendar picker controls for easier date selection.
- Changing Range Logic:
- Select the date range slicer.
- Go to the slicer’s formatting controls.
- Navigate to Slicer Settings and alter the Style option.
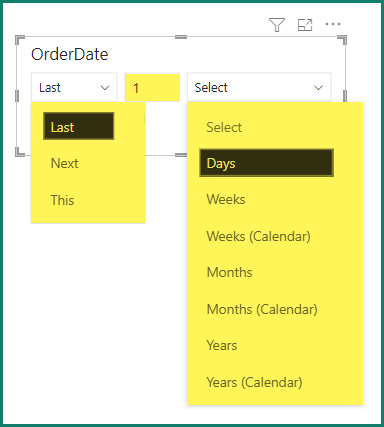
Relative Date Slicer in Power BI
The relative date slicer in Power BI is a powerful tool for applying time-based filters to any date column in your data model.
Benefits of the Relative Date Slicer
The relative date slicer allows you to:
- Show data from a specific time frame, such as the last 30 days, last month, or last year.
- Automatically update the data to reflect the most recent period when refreshed.
Sync Slicers in Power BI
Syncing slicers in Power BI is a great way to ensure slicer selections on one page carry over to other pages. This can save time and improve report consistency.
Benefits of Sync Slicers
- Time Saver: Eliminates the need to create the same slicer on multiple pages.
- Consistency: Ensures that slicer selections are consistent across multiple report pages.
How to Sync Slicers in Power BI
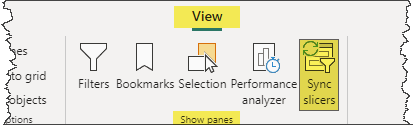
- Activate Sync Slicers Pane:
- Go to View (tab).
- Select Show Panes (group).
- Click on Sync Slicers.
- Select a Slicer:
- Choose a slicer in your report.
- The Sync Slicers pane will display a list of all pages in the report with two control columns: “sync” and “visible.”
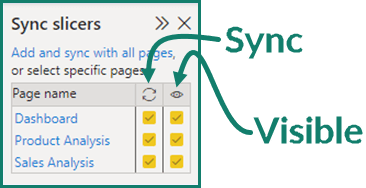
- Sync Control:
- Check the sync box to enable synchronization of the slicer across selected pages.
- Uncheck the sync box to disable synchronization.
- Visible Control:
- Check the visible box to show the slicer on the selected page.
- Uncheck the visible box to hide the slicer on the selected page.
- Note: Checking the visible box for a page without the slicer will automatically create the slicer on that page.
Tips for Using Sync Slicers
- Copy and Paste: Copying and pasting a slicer to another page will keep the slicer’s position and size. You can freely move and resize the pasted slicer without affecting the original.
- Invisible Synced Slicers: Be cautious with invisible synced slicers, as they can cause confusion. Hover over the funnel icon in the corner of a visual to see active filters.
Learn Power BI effortlessly in just 1 hour!
No experience needed.
The course takes a little over an hour to complete. Click Here for Instant Access!
We’re not sure how long this course will remain free. If you’ve been thinking about learning Power BI, sign up now before it’s too late!
Featured Bundle
Power Excel Bundle


Leila Gharani
I’ve spent over 20 years helping businesses use data to improve their results. I've worked as an economist and a consultant. I spent 12 years in corporate roles across finance, operations, and IT—managing SAP and Oracle projects.
As a 7-time Microsoft MVP, I have deep knowledge of tools like Excel and Power BI.
I love making complex tech topics easy to understand. There’s nothing better than helping someone realize they can do it themselves. I’m always learning new things too and finding better ways to help others succeed.