Download the free workbook and start using Python in Excel today!
What is Python in Excel?
Microsoft has added Python to Excel. Now, you can run Python scripts directly in your spreadsheets.
This powerful combination lets you use Python’s advanced tools without leaving Excel.
What is Python?
Python is a popular programming language known for its simplicity and versatility. It’s used for data analysis, automation, and more.
With Python in Excel, you get the best of both worlds.
Benefits of Using Python in Excel:
- Efficiency: Automate repetitive tasks and save time.
- Advanced Analysis: Perform complex data calculations with ease with Python libraries like Pandas and NumPy.
- Better Visuals: Create detailed and dynamic charts and graphs with tools like Matplotlib and Seaborn.
- Integration: Seamlessly blend Python’s capabilities with Excel’s familiar interface.
How to Start Using Python in Excel
To use Python in Excel, you can use 2 options:
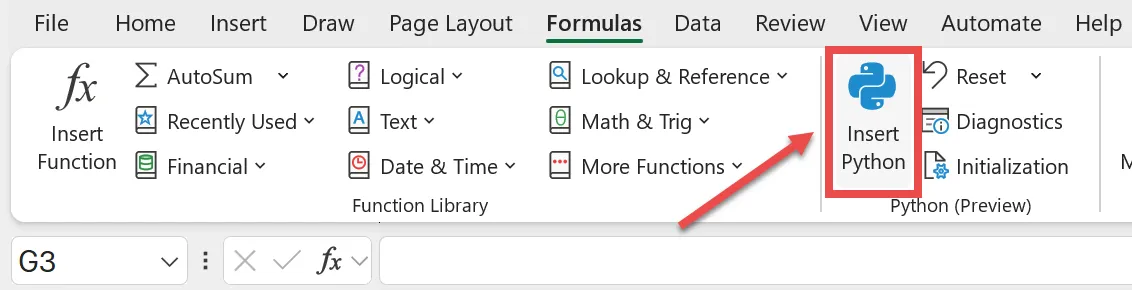
- Go to the Formulas tab and click “Insert Python” in the Python section.

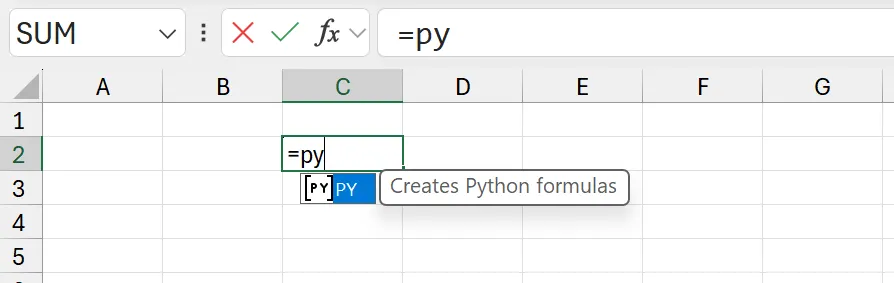
- Or, type in “=PY” in a cell and press Tab.

Send Excel Data to Python – Create a DataFrame
To use Excel with Python, you need to create a DataFrame. This makes data manipulation easy and efficient.
💡 Python for Excel works in the cloud, so you’ll need an internet connection to access it.
What is a DataFrame?
A DataFrame is like a table in Excel or a database. It has rows and columns for storing data.
You can use DataFrames to handle large datasets easily. It can hold the content of an entire Excel data table in a single cell.
DataFrames are part of the Pandas library in Python. Pandas provides strong tools for data analysis, making it simple to work with your data.
💡 In Python for Excel, a DataFrame is the default object used for two-dimensional ranges.
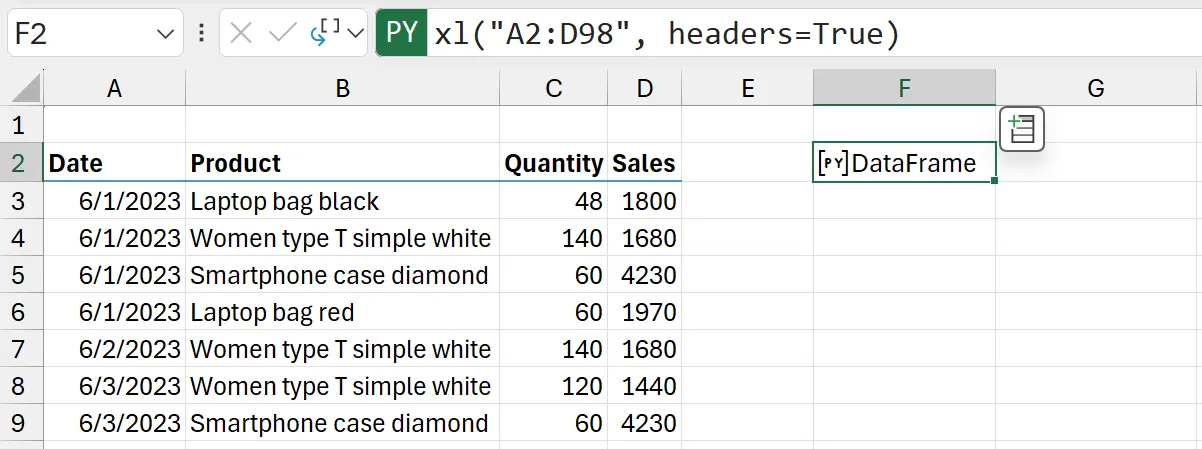
How to Create a DataFrame in Excel
Here are the steps to create a Python DataFrame in Excel:
- Type “=PY” in a cell and press Tab.
- Select the data in your table (in our example A2:D98).
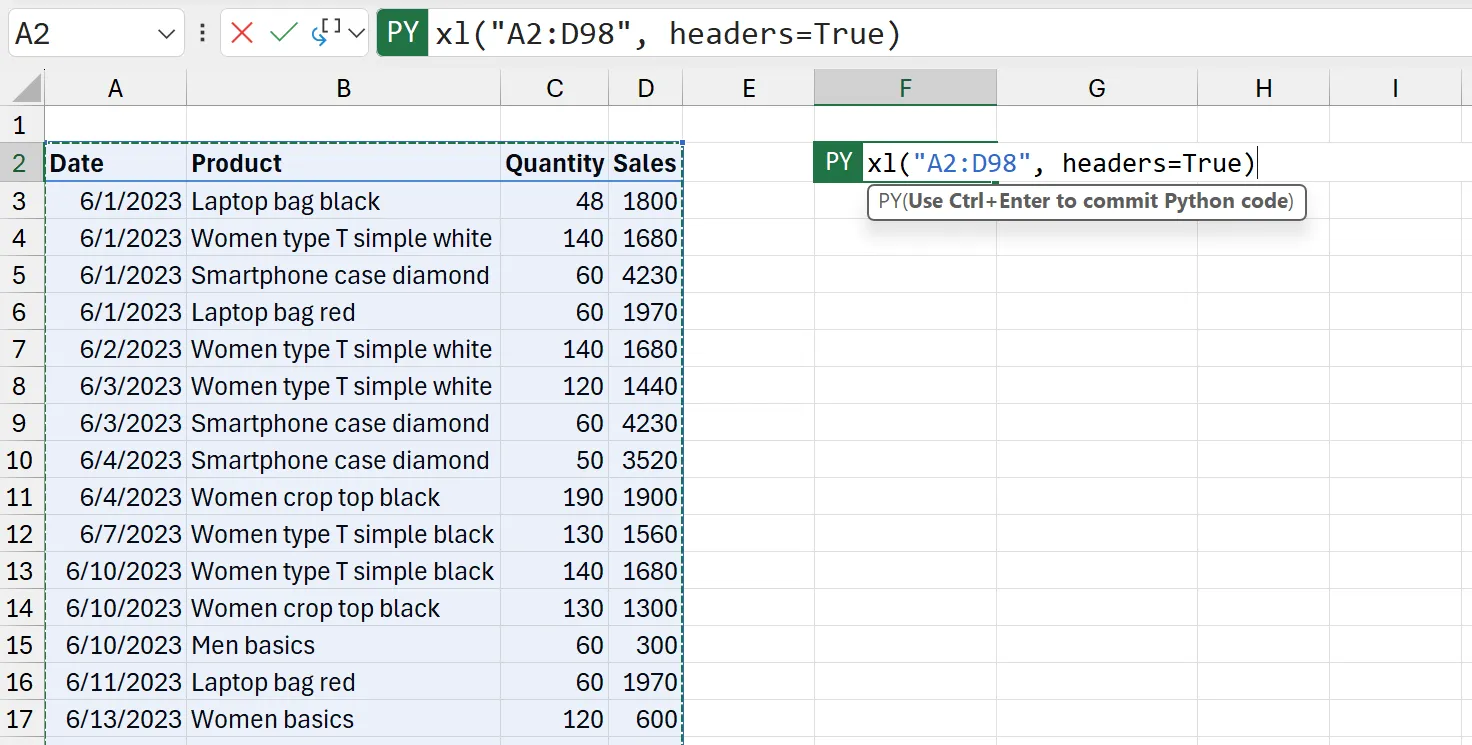

- Press Ctrl + Enter to create the Python DataFrame

Output Types for DataFrames
Python in Excel can output a DataFrame in two ways: as a Python object or converted to Excel values.
Python Objects
Useful for reusing results in future Python calculations.
When a DataFrame is returned as a Python object in Excel, the cell shows “DataFrame” with a “PY” in square brackets before it.

- To see the details within a DataFrame in Excel, click the [PY] icon in the cell to show the card.
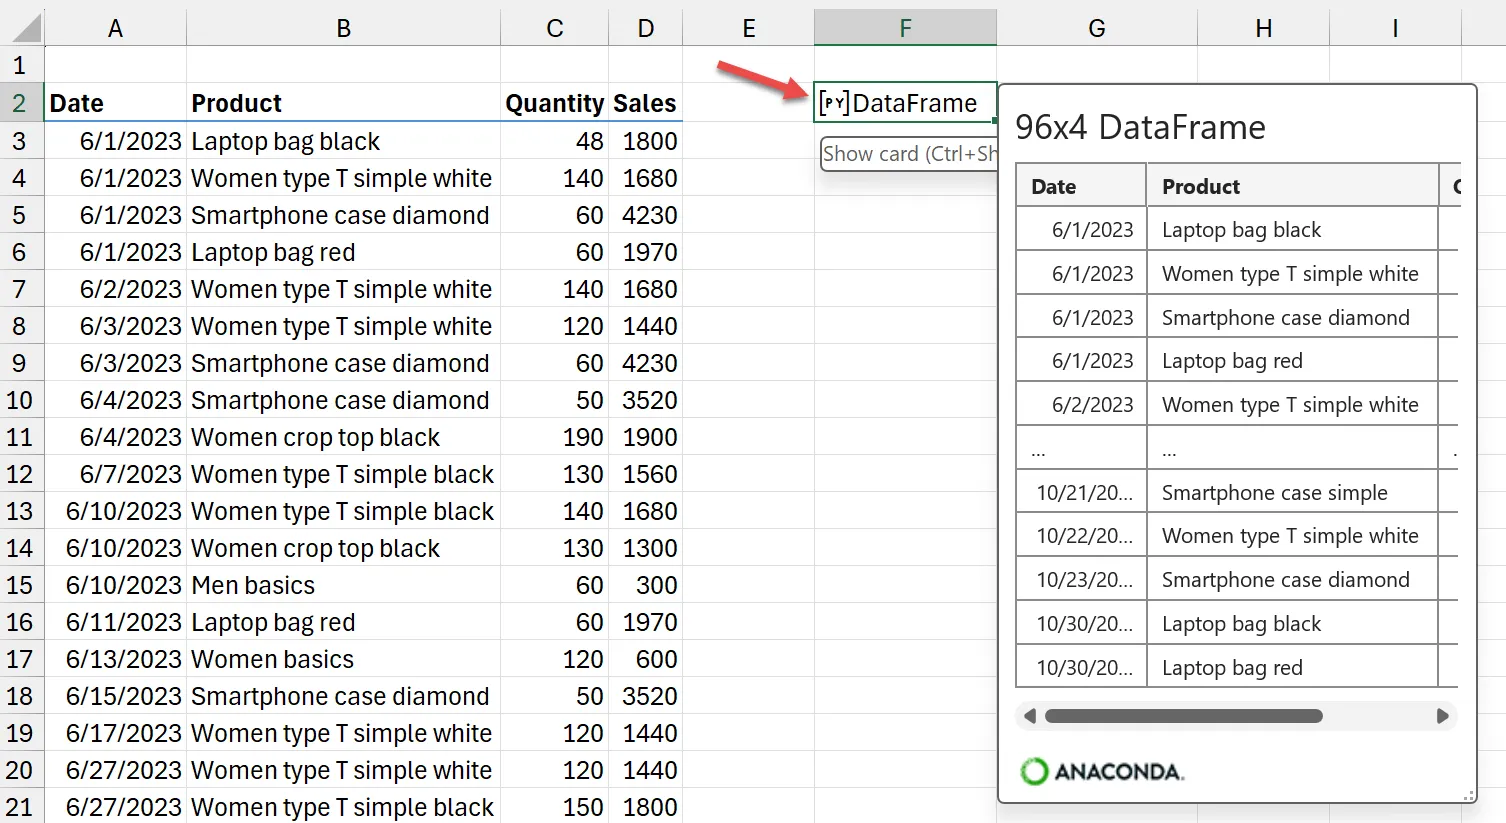

- Alternatively, press the keyboard shortcut Ctrl + Shift + F5.
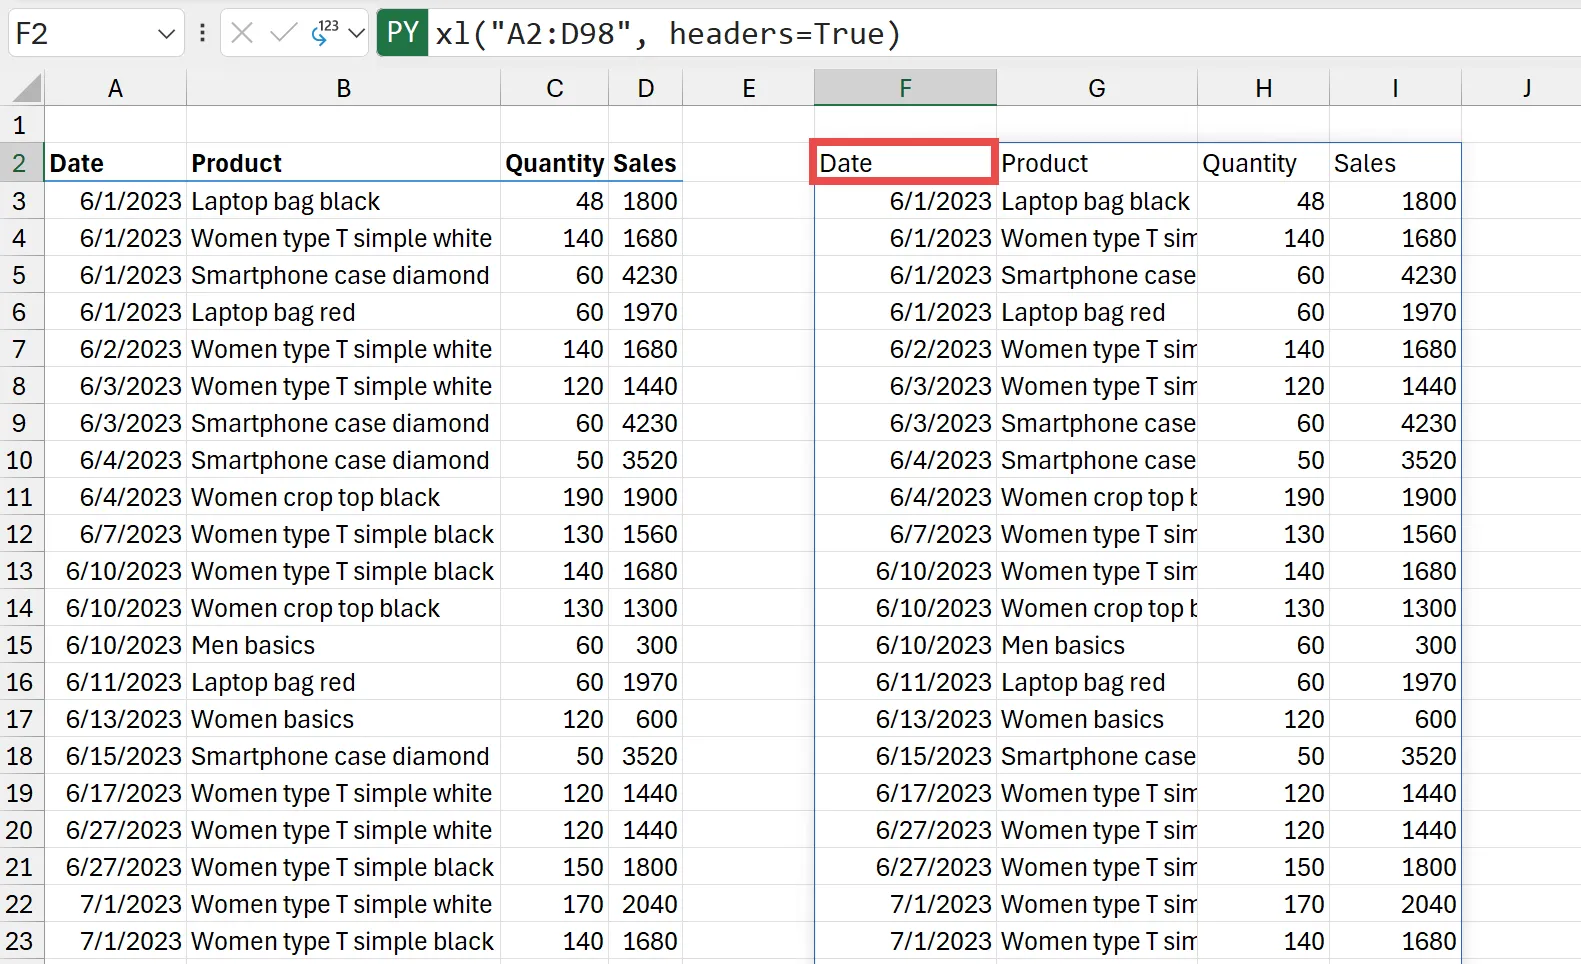
Excel Values
You can also output DataFrames translated to the closest Excel format. This allows you to use Excel features like charts, formulas, and conditional formatting.

💡 If a cell in the output range (e.g., F2 to I98) already contains a value, the Python cell will return a #SPILL! error instead of the Python output.
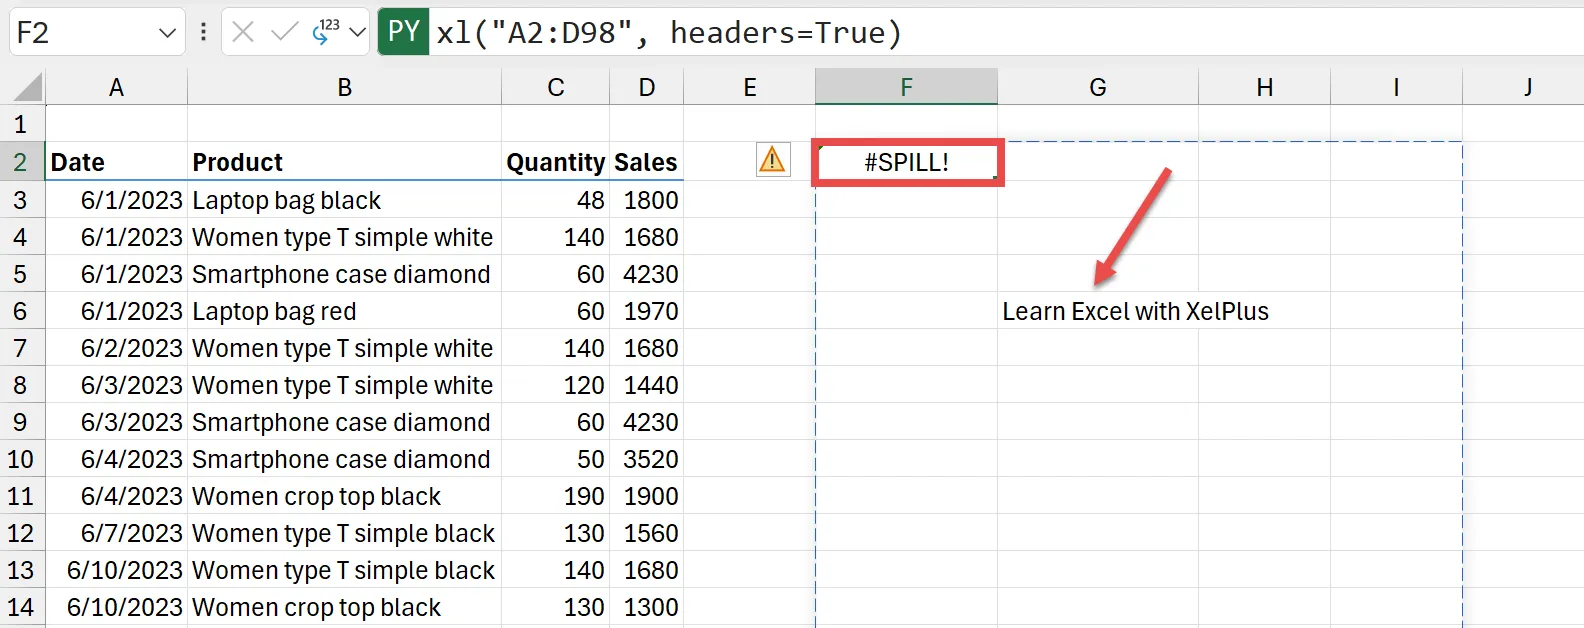

💡 To learn more about #SPILL! errors and how to correct them, see this detailed article.
Controlling Python Output Types in Excel
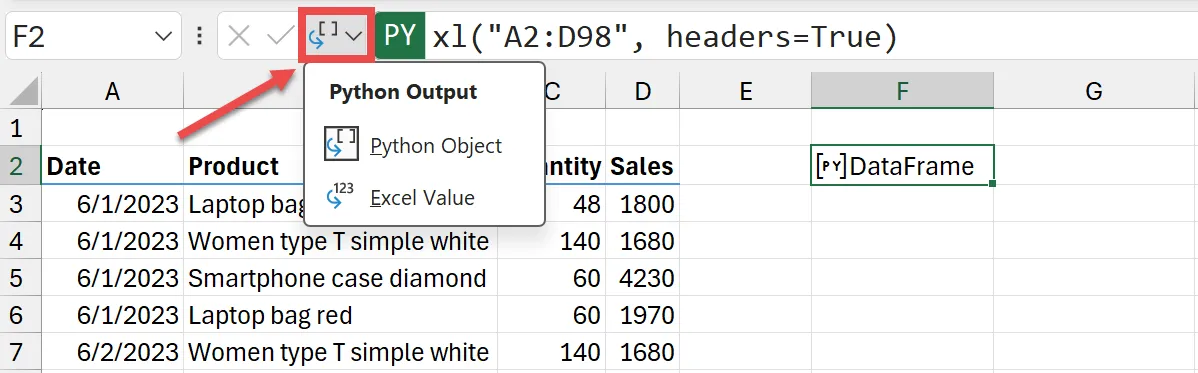
You can control how Python outputs DataFrames in Excel using the Python output menu in the formula bar.
- Click on the cell with the DataFrame.
- In the formula bar, look to the left of the green PY icon for the dropdown menu.
- Choose the output type: either Python Object or Excel Value.

- Alternatively, you can right-click on the cell containing the DataFrame. Then choose “Python Output,” and select the desired output format.
Choosing ‘Python Object’ keeps the data in Python format. ‘Excel Value’ converts it to an Excel-friendly format.
Featured Bundle
Power Excel Bundle


How to Use DataFrames in Excel
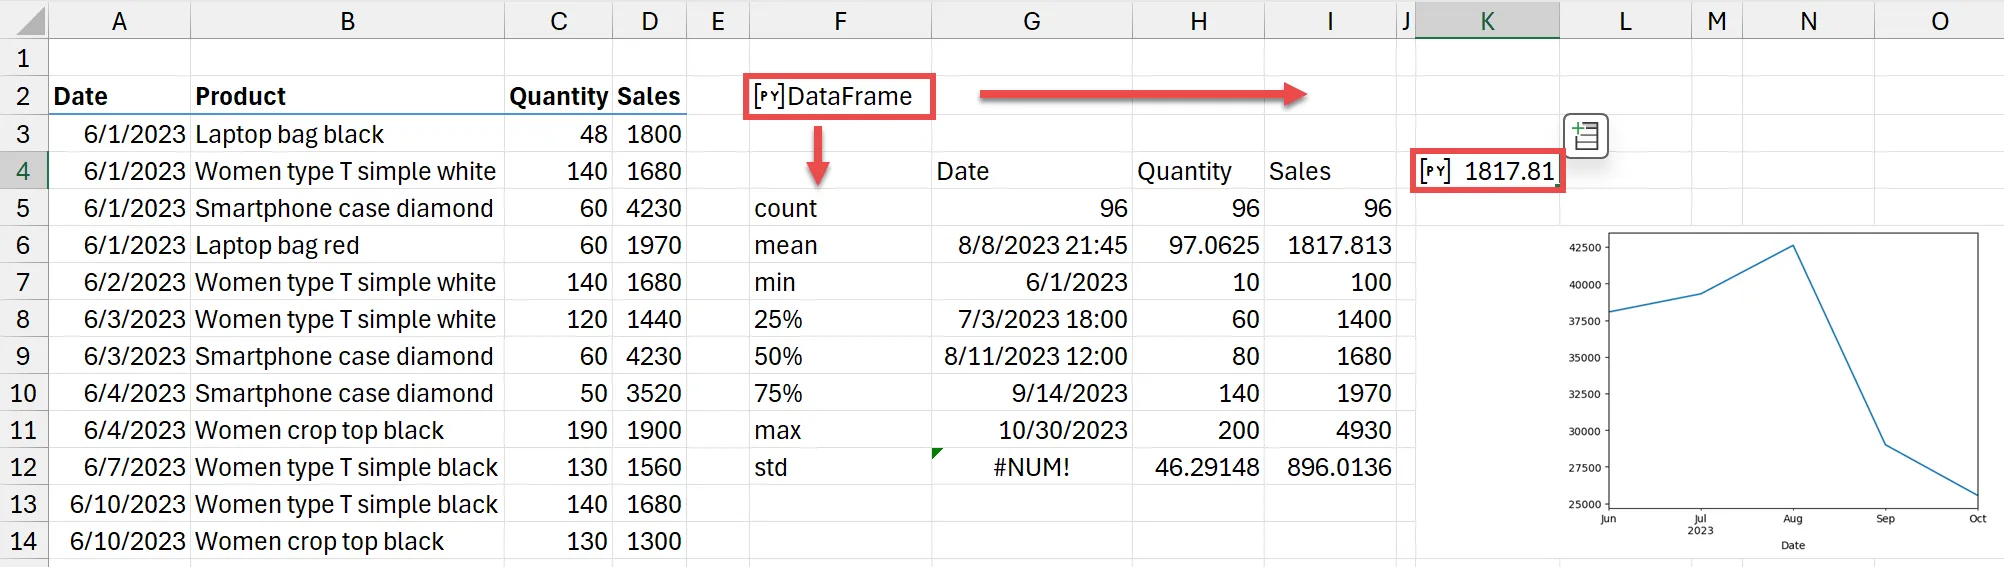
Describe Data with Pandas
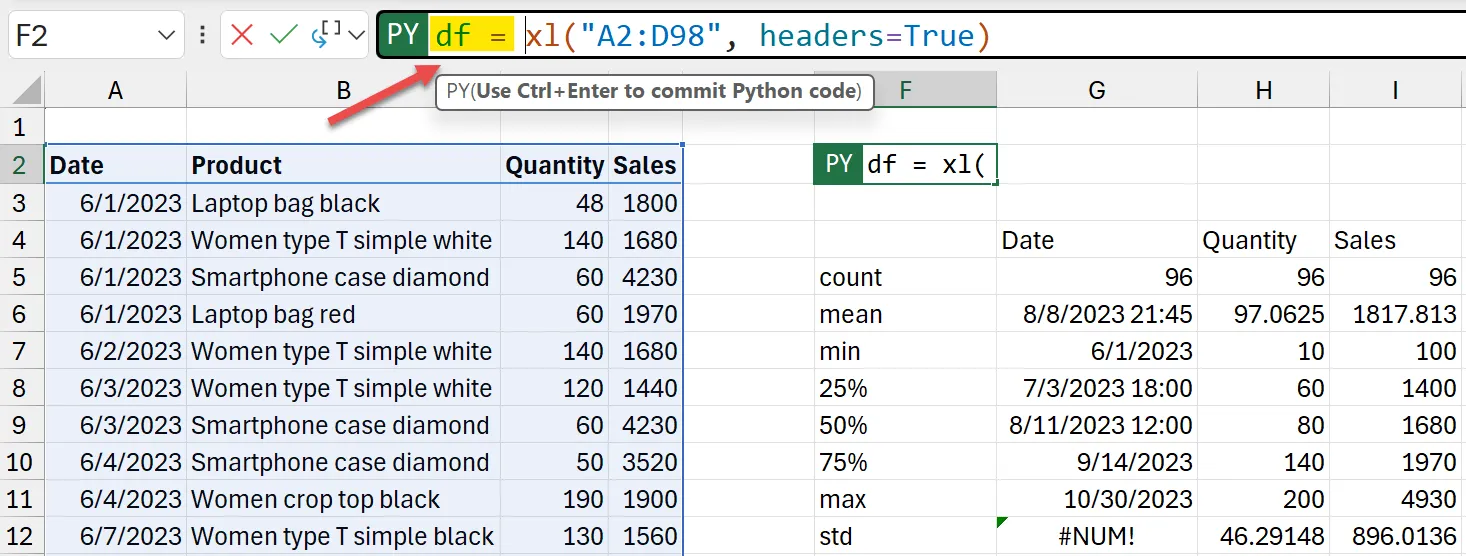
Use the describe() Function in Pandas to get basic statistical insights about your data in the DataFrame.
This function provides details such as count, mean, standard deviation, minimum, maximum, and percentiles.
Steps to Use describe() in Excel:
- Select a Cell: Click on a cell in Excel where you want to display the output, e.g., F4.
- Enter Python Mode: Type =PY in the formula bar and press Tab to enter Python mode.
- Reference the DataFrame: Click on the cell that contains your DataFrame, e.g., F2.
- Use the Describe Function: Add .describe() to the reference and press Ctrl + Enter to run the code.
=PY(F2.describe())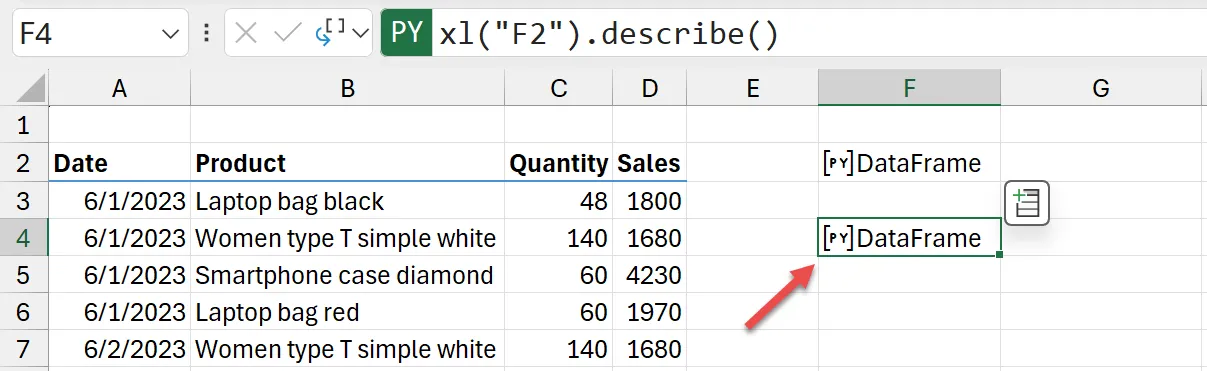

- Change Output Type: Make sure the Python output is set to Excel Data.
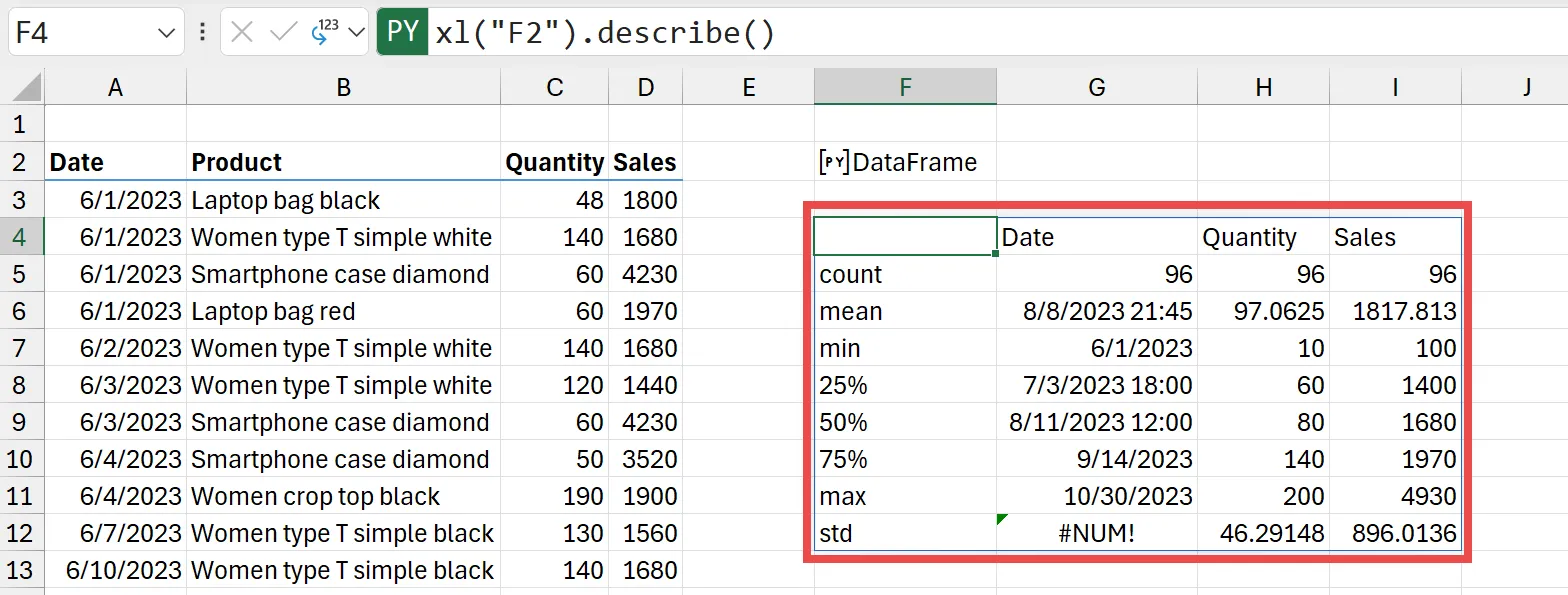

Using the describe() function helps you quickly understand the distribution and central tendency of your data, making it easier to identify trends and outliers.
Name Your DataFrame
I recommend giving your DataFrame a name for easier referencing and better code readability.
When you name your DataFrame, you can quickly and clearly refer to it in your code. Here’s how to do it:
- Select the Cell: Click on the cell with the DataFrame.
- Assign a Name: Update the beginning of the formula by giving it a name, e.g., df.

- Execute: Press Ctrl + Enter to apply the name
Naming the DataFrame allows you to use a simple reference throughout your code. This is much easier than using the full data frame code each time you need to access it.
Calculations with Python DataFrames in Excel
Simple Sum and Average Calculations
The Pandas library offers many functionalities for data manipulation and analysis. Some simple ones include calculating the sum and average of a column. Here’s how you can perform these calculations in Excel using Python:
- Select a Cell: Click on a cell in Excel where you want to display the result, e.g., K4.
- Enter Python Mode: Use the keyboard shortcut Ctrl + Alt + Shift + P to enter Python mode.
- Reference the DataFrame: Use the name of your DataFrame, e.g., df, and the header of the column you want to calculate, e.g., Sales.
- Add the SUM() Function: Type the formula to calculate the sum.
=PY(df.Sales.sum())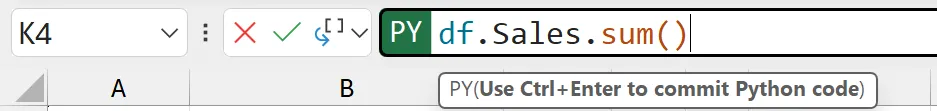

- Execute: Press Ctrl + Enter to run the calculation
This will calculate the total of the Sales column in cell K4.
Similarly, to calculate the average of the Sales column:
=PY(df.Sales.mean())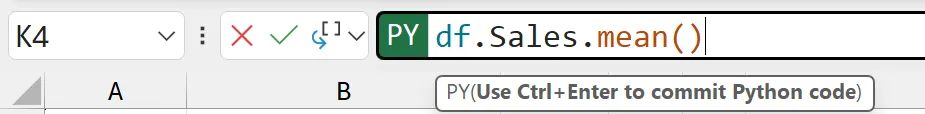

Aggregating Data with Pandas Series in Excel
Apart from simple operations like sum and average, you can also easily aggregate your data using Pandas Series.
A Series is similar to a single column in a table. It’s a one-dimensional array that can hold data of any type.
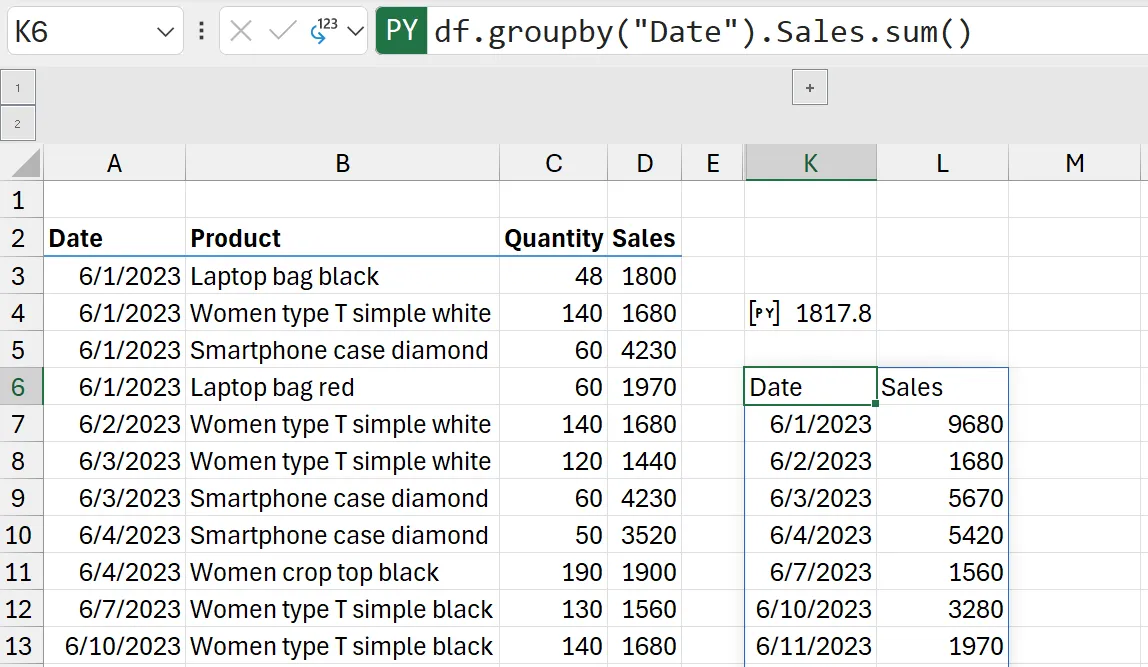
For example, you can use the groupby() function to aggregate your DataFrame by date:
- Enter the Python code: We’ll reference the dataframe “df” and apply the groupby() function to aggregate the sales column by date
=PY(df.groupby("Date").Sales.sum())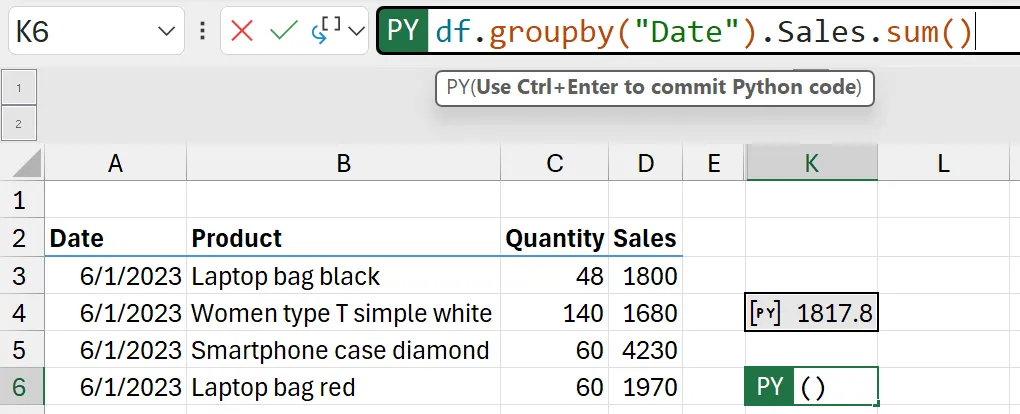

- Change Output Type: In the formula bar, use the dropdown menu next to the green PY icon to change the output from Python Series to Excel data.

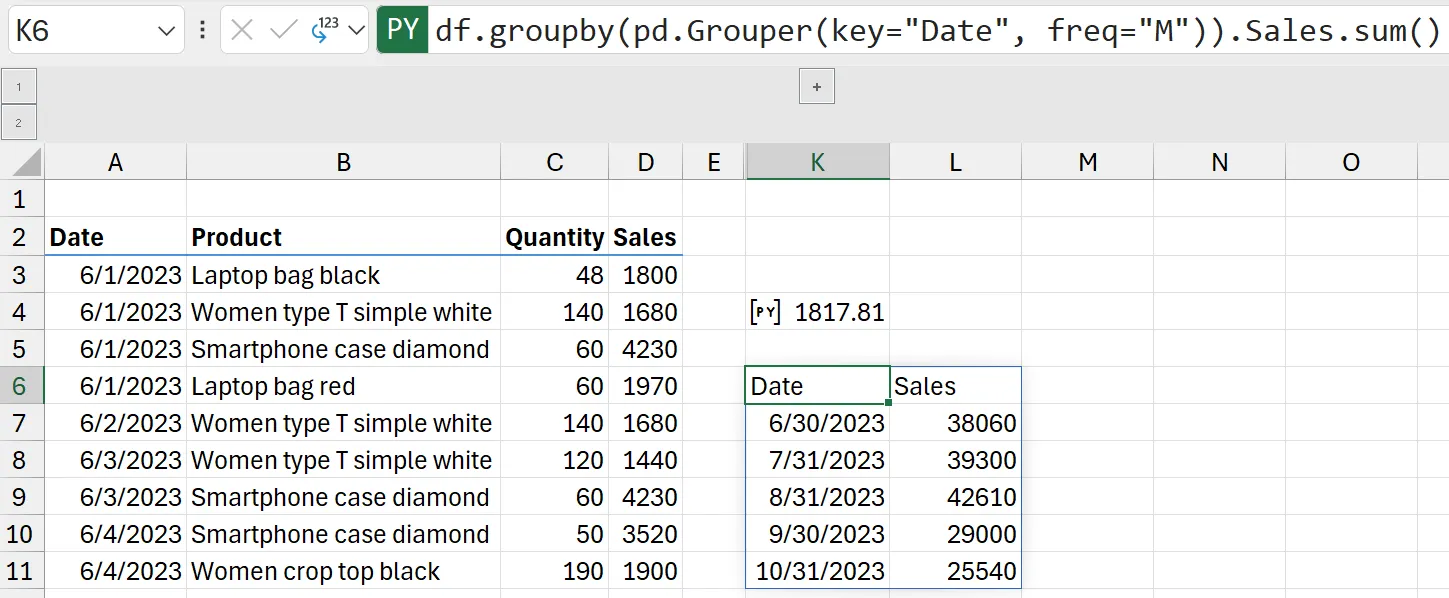
You can also change the aggregation easily by using Grouper. A Grouper is a Pandas class that allows you to group data by a specific frequency.
How to Use Grouper:
=PY(df.groupby(pd.Grouper(key="Date", freq="M")).Sales.sum())- key: Represents the column you want to group by, in this case, “Date”.
- freq: Stands for frequency. “M” means monthly, so the data will be aggregated on a monthly basis.
After executing the code with Ctrl + Enter, Excel will display the aggregated sales data on a monthly basis.

Using the Grouper function in Pandas allows you to perform flexible and powerful data aggregations based on different time frequencies. This feature is especially useful for time series data and helps you uncover trends and patterns over specific periods.
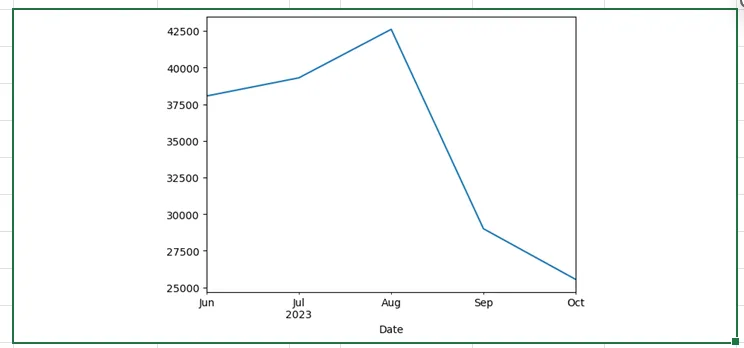
Plot a Chart with Pandas plot() Method in Excel
You can use the Pandas plot() method to create charts directly in Excel cells. Here’s how to do it:
- Group Data: Aggregate your data by date on a monthly basis.
forchart = df.groupby(pd.Grouper(key="Date", freq="M")).Sales.sum()- Create the Plot: Use the plot() method to create a line chart.
forchart.plot(x="Date", y="Sales", kind="line")

- Parameters:
- forchart: The variable name assigned to the grouped data for the chart.
- x: Defines which data to show on the x-axis, e.g., the date.
- y: Defines which data to show on the y-axis, e.g., sales values.
- kind: Defines the type of chart to plot, e.g., line, area, bar.
- Increase the size of the chart: Merge some cells next to the cell with the chart.

Featured Course
Automate Excel: Power Query & Power Automate Recipes


Calculation Order of Python Cells
In Excel, Python calculations follow a specific order:
- Top to Bottom: Just like traditional Python code, Python statements in Excel cells calculate from top to bottom within a single cell.
- Across Rows and Down Columns: In an Excel worksheet, Python cells calculate from left to right across each row. After finishing one row, it moves to the next row.
Understanding this calculation order helps you organize your data and formulas efficiently, preventing errors and ensuring your results are accurate.
Example Setup 1:
- DataFrame Location: The DataFrame holding the data is in cell F2.
- Average Calculation: We want to calculate the average in cell K4.
Since Python in Excel calculates from left to right, the setup works. Cell F2 (where the DataFrame is defined) is to the left of cell K4 (where we calculate the average).

Let’s see what happens if we move the calculation
Example Setup 2:
- DataFrame Location: The DataFrame holding the data is in cell F2.
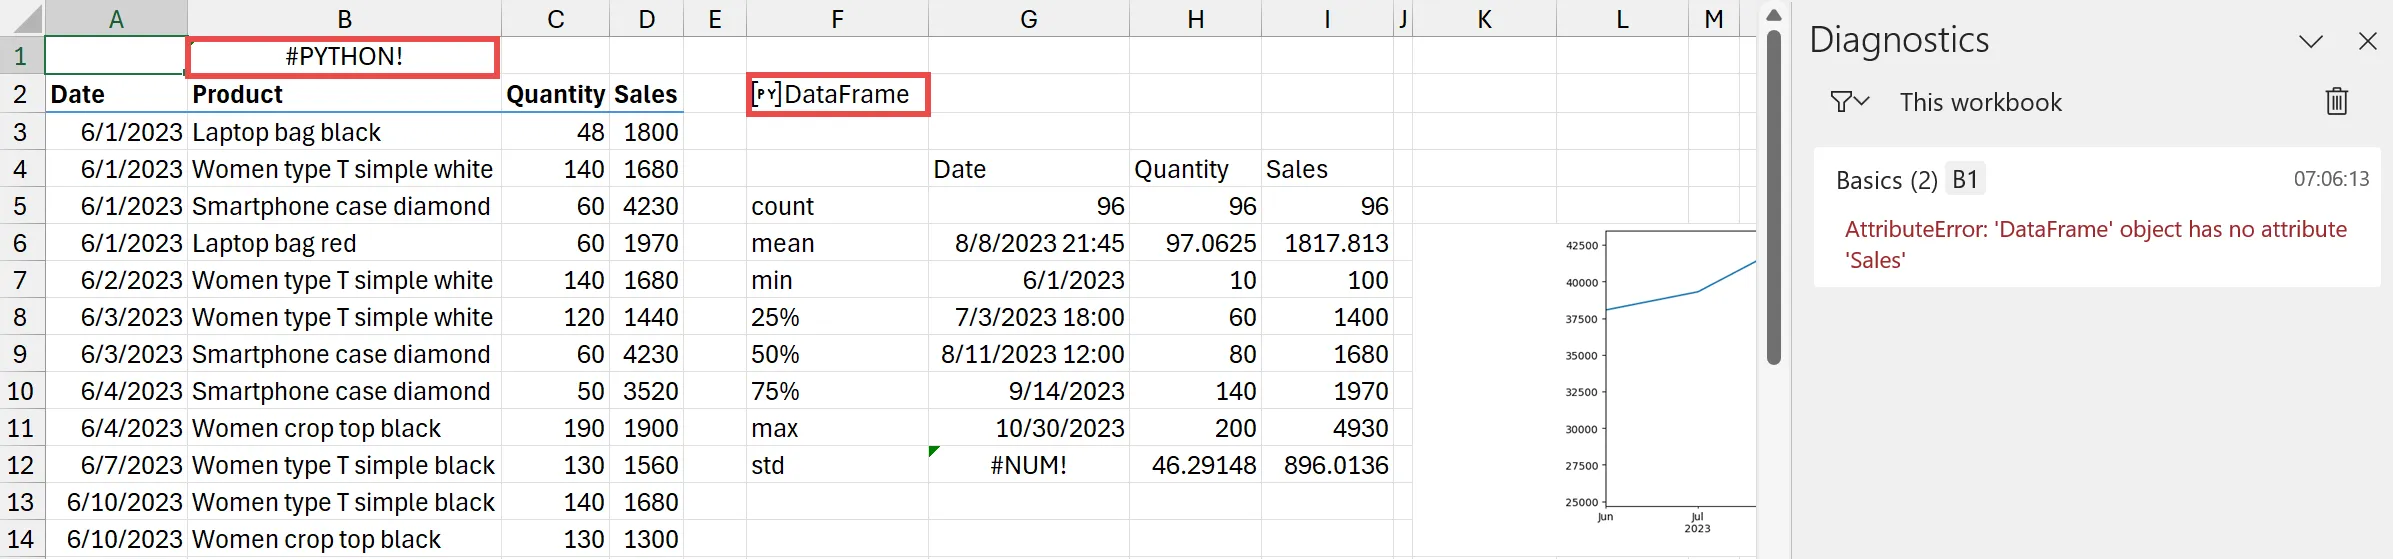
- Average Calculation: We want to calculate the average in cell B1.
This causes an error because it tries to reference Sales from the DataFrame before it’s defined.

Key Points to Remember
- Order Matters: Always place your variable definitions in cells that come before the cells where you use them.
- Across Worksheets: Organize your worksheets so that data and variable definitions come first, followed by your analysis and calculations.
Example: Extract URL from String with Python
You can find and extract URLs from text data in your Excel sheets using Python and regular expressions (Regex).

Here is the Step-by-Step Guide:
Step 1: Import the ‘re’ Library:
The re library allows you to work with regular expressions in Python, which are powerful tools for pattern matching. Since it’s not part of the default libraries, we need to import it. We will do this in cell A1.
=import re
"re loaded"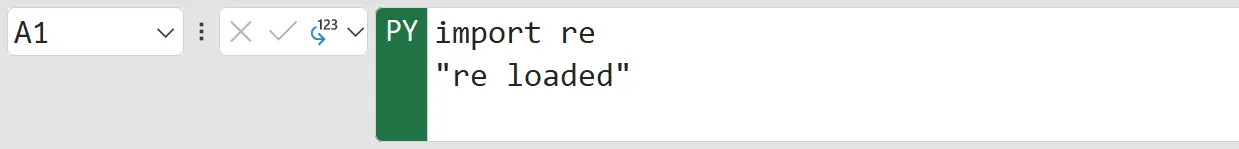

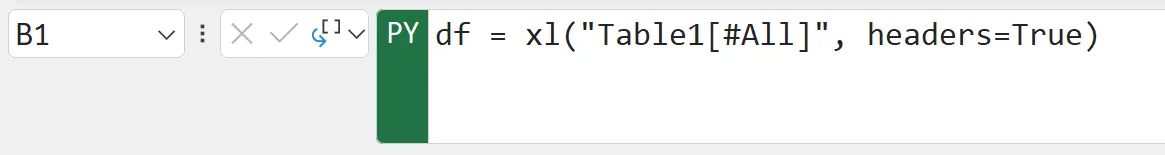
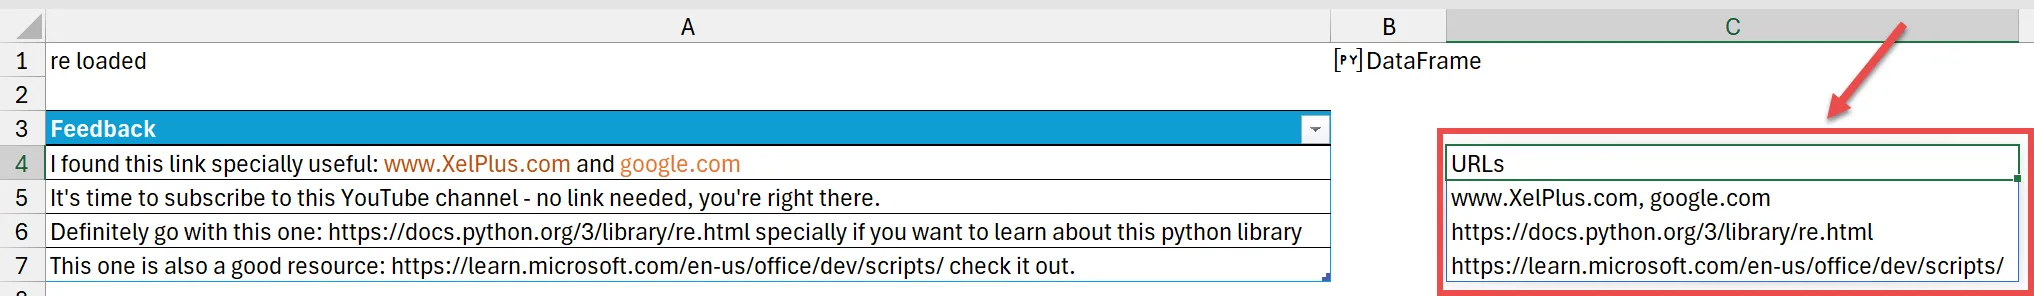
Step 2: Define the DataFrame
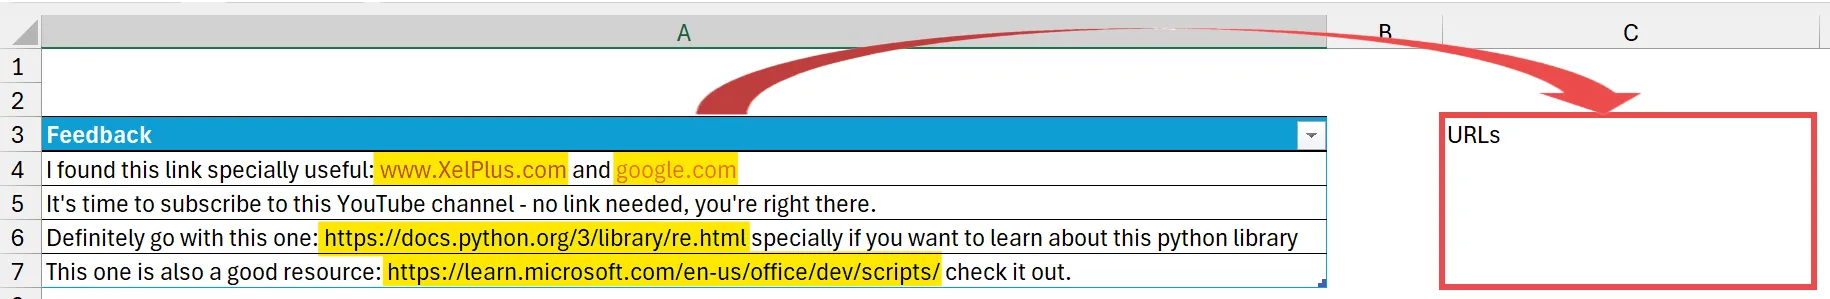
In this step, we’re sending the Excel data we want to use to Python. Suppose the data is in an Excel table named “Table1” located in cells A3 to A7. We’ll include the headers using the ‘#All’ argument and define the DataFrame in cell B1:
=PY(df = xl("Table1[#All]", headers=True))💡 By referencing the table, we ensure that all data is included, even if new rows are added later.

Step 3: Apply the Extraction Code
We use Regular Expression (Regex) pattern to extract the URLs.
pattern_combined = r'https://\S+|http://\S+|www.\S+|\b[^ ]+.com\b'
Function to run on each text
def extract_urls(text):
url_pattern = re.compile(pattern_combined)
urls = url_pattern.findall(text)
return ', '.join(urls)
Apply the function to the dataframe
df['URLs'] = df['Feedback'].apply(extract_urls)
Filter out rows without URLs and keep only the URLs column
df_urls_only = df[df['URLs'] != ''][['URLs']]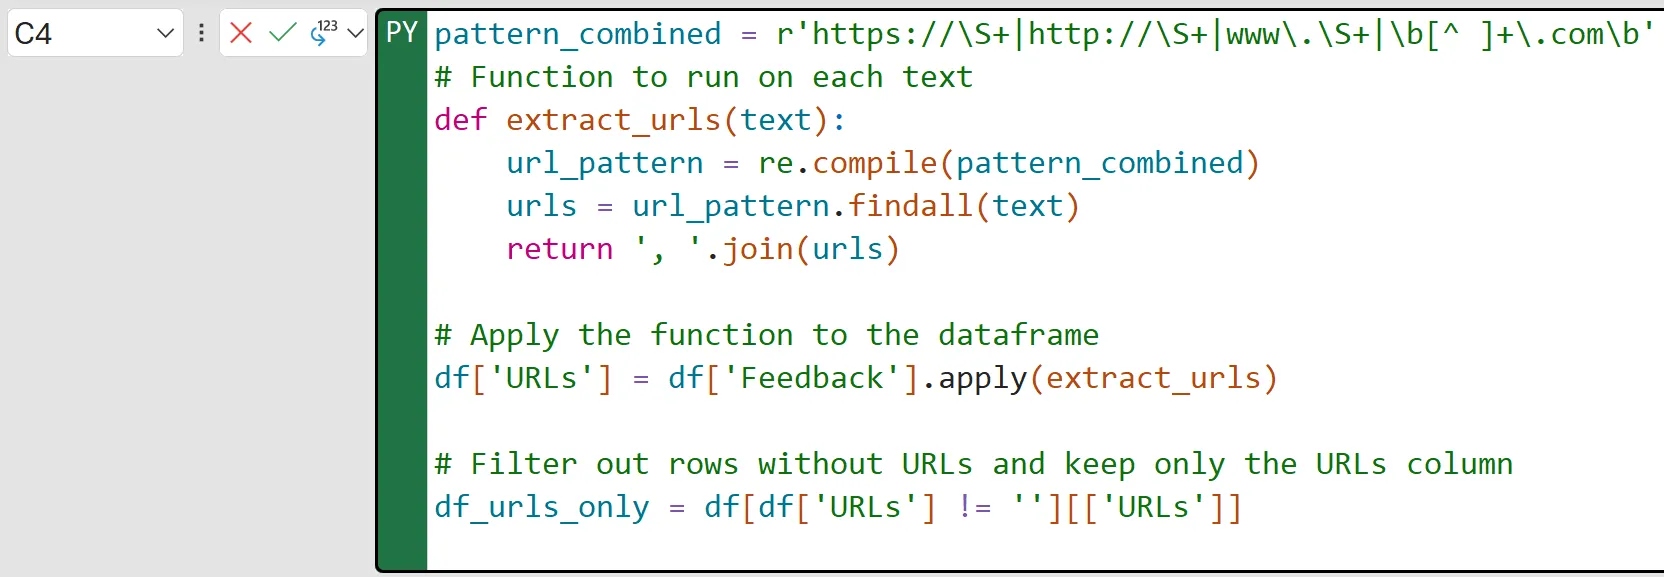

- The Regex pattern r’https://\S+|http://\S+|www.\S+|\b[^ ]+.com\b’ is used to find URLs in different formats.
- Use the apply() method to apply the function to the ‘Feedback’ column of the DataFrame.
- Filter out rows without URL and store the extracted URLs in a new column ‘URLs’.
After executing the code with Ctrl + Enter, we get the extracted URLs displayed in the specified cells.

For more information about Regular Expressions, check out this detailed article.
Pandas Library
For more detailed guides and examples, check out the Pandas library.
Availability of Python in Excel
Python for Excel is currently available in Microsoft 365 for Windows.
As of September 2024, it’s rolling out to Enterprise and Business users running the Current Channel (version 2407 or later).
It’s available in preview for Education users running the Current Channel (Preview) through the Insider Program.
It’s also in preview for Family and Personal users running the Current Channel, starting with version 2405.
Download the Workbook
Enhance your learning experience by downloading our workbook. Practice the techniques discussed in real-time and master how to use Python in Excel with hands-on examples. Download the workbook here and start applying what you’ve learned directly in Excel.
Featured Bundle
Black Belt Excel Bundle


Leila Gharani
I’ve spent over 20 years helping businesses use data to improve their results. I've worked as an economist and a consultant. I spent 12 years in corporate roles across finance, operations, and IT—managing SAP and Oracle projects.
As a 7-time Microsoft MVP, I have deep knowledge of tools like Excel and Power BI.
I love making complex tech topics easy to understand. There’s nothing better than helping someone realize they can do it themselves. I’m always learning new things too and finding better ways to help others succeed.