


Download the data files 👉 HERE and build your first Power BI dashboard.
What is Power BI?
Power BI is a business intelligence tool from Microsoft. It helps you import data from various sources, analyze it, and create visual reports. These reports can be securely shared within your organization. Power BI helps you make better decisions. It lets you track key performance indicators (KPIs) and spot trends in your data. It’s a valuable tool for both new and experienced data analysts.
Different Power BI Apps
Power BI includes several products and services, each with a unique purpose:
- Power BI Desktop: A free desktop application for building reports.
- Power BI Service: An online portal for storing and sharing reports and dashboards. You can create a free account with a work or school email, but sharing features require a paid license.
- Power BI Mobile App: A free app for viewing published reports and dashboards, available on Windows, Android, and iOS.
Additional tools include:
- Power BI Report Builder: For creating paginated reports, ideal for printing and PDFs.
- Power BI Report Server: An on-premises solution for storing and sharing reports on a local server through a secure portal.
Power BI Desktop is the tool you will use the most.
Is Power BI Free?
Yes, Power BI offers both free and paid versions. But, there are some key distinctions:
Power BI Desktop
- Free: Power BI Desktop is free to download and use on your computer. It includes all the essential features for creating and viewing reports.
Power BI Service
- Free Version: You can use Power BI Service for free, but with limited capabilities. The free version allows you to publish reports to “My Workspace,” but sharing and collaboration are restricted. You cannot share reports with others unless you use the “Publish to web” feature, which makes your report public on the internet and accessible to anyone with the link.
Power BI Pro
Power BI Pro requires a subscription and offers advanced sharing and collaboration features. With Pro, you can share reports and dashboards with colleagues, allowing full interactivity and collaboration. This is ideal for larger teams and businesses.
Power BI Premium
- Paid: Power BI Premium is designed for large organizations. It provides dedicated cloud resources, advanced features like paginated reports, and AI capabilities. This option is more expensive and is suitable for enterprise-level needs.

Learn Power BI in 1 Hour – 💪 Start Now!
In JUST 60 Minutes, you can create your first Power BI report. Start NOW and see how easy it can be. (1 Month Access).
12973 students enrolled
Last updated Oct 16th, 2025
Please note: No credit card information is required to sign up. If you don’t have an account with our Teachable XelPlus Academy you will need to create one.
Why Use Power BI?
Learn Power BI for these benefits:
- User-Friendly Interface: It’s easy to use, even for beginners.
- Data Integration: Import data from a wide range of sources.
- Powerful Analytics: Analyze data to gain insights and make informed decisions.
- Customizable Reports: Create interactive reports and dashboards tailored to your needs.
- Secure Sharing: Share your reports securely within your organization.
- Mobile Access: View reports on the go with the mobile app.
Power BI empowers you to transform your data into actionable insights, making it an essential tool for any data analyst.
Download Power BI Desktop
Downloading Power BI Desktop is simple and free. Here’s how you can get it:
For Windows 10/11 Users
- Go to the Microsoft Store and search for “Power BI Desktop”.
- Click the “Install” button.
- Windows will automatically install Power BI Desktop and keep it updated.

The main advantage of using the Microsoft Store is automatic updates. Microsoft releases updates for Power BI monthly, so you won’t have to reinstall it each time.
For Other Operating Systems
- Visit the PowerBI.com website.
- Click the “Download” link.
- Follow the instructions to download and install Power BI Desktop.

This method is useful if you are using an older version of Windows or a different operating system.
Featured Course
Fast Track to Power BI

Power BI Login
After downloading and installing Power BI Desktop, you can easily log in and start using it. Here’s how:
Launch Power BI Desktop:
Open Power BI Desktop on your computer.
Sign In:
- Click on the “Sign In” button.
- Enter your work or school email address.
- Follow the prompts to complete the login process.
💡 Tip: You can use Power BI Desktop without signing in. However, you will need to sign in when you’re ready to publish your report to the Power BI Service.

The Power BI Main Components
Power BI Desktop consists of three main components that help you create detailed and interactive reports:

Report View:
- This is where you build and present all your visualizations.
- You can create tables, charts, graphs, slicers, KPIs, cards, buttons, logos, icons, and more.
- Why it’s useful: It lets you design and customize how data looks. This makes it easier to understand and share insights.

Data View:
- Displays tables of data imported from your sources.
- You can clean, transform, and prepare your data here.
- Why it’s useful: It shows your raw data clearly. This helps you check if it is accurate and consistent before making visualizations.

Model View:
- Shows a bird’s-eye view of the tables from the Data View.
- Displays the relationships between the tables using connectors.
- Why it’s useful: It helps you understand the relationships between data sets. It also helps you manage them. This ensures your reports are accurate and complete.

Featured Course
Master Excel Power Query – Beginner to Pro

Creating a Power BI Dashboard
Creating a Power BI dashboard starts with acquiring the data for your report visualizations. Here’s a step-by-step guide:
Data Sources
You can get data from various sources, including:
- Delimited Text Files
- Excel Workbooks
- Databases
- Websites
- PDF Files
- Folders
- Online Services
Power BI provides many connectors, which are updated regularly. Click “Get Data” to see the full list.


For this Power BI dashboard, we’ll use two sources:
- Excel Workbook: “CustomerMaster.xlsx” with a table named “MasterCustomer” containing customer information.
- Text File: “InvoiceData.txt” containing sales transactions.
Loading the Invoice Data
- Get Data: Click “Get Data” and browse to “InvoiceData.txt”.
- Preview: Verify the file and delimiter.

Importing a text file to Power BI.
- Load or Transform: Choose “Load” to import data directly to the Power BI Data Model. Choose “Transform Data” to open Power Query for data preparation.
Even if no transformations seem needed, transforming data into Power Query ensures proper interpretation, such as dates.

Power Query Capabilities:
- Remove unwanted columns
- Filter rows
- Create calculations, like Profit (Sale Price – Cost)
If you’re familiar with Power Query in Excel, you’ll find it similar in Power BI. Learn more about Power Query in this article.
Applied Steps in Power Query:
Power Query performed several transformations steps automatically.
- Source: Import data from the file.
- Promoted Headers: Use the first row as headers.
- Changed Type: Assign appropriate data types.
Verify these steps to ensure they meet your needs. Adjust data types for efficiency, such as using whole numbers instead of decimals when appropriate.
Merging Columns Example:
Combine “Year”, “Month”, and “Day” into a single “Date” column:

- Select columns while holding Ctrl.
- Click “Transform” -> “Merge Columns“.

- Use “/” as a separator and name the new column “Date”.
- Set the new column’s data type to “Date”.

This is how you can combine two or more data columns into one in Power Query.

💡 All performed steps are recorded in the Applied Steps panel on the right. Simply refresh the data to apply these steps to updated source files.

Loading the Customer Information
The customer information is located in the Excel file named “CustomerMaster.xlsx”.
- New Source: Select “Home” -> “New Source” -> “Excel Workbook”.

- Preview: Choose the table “MasterCustomer1” and click “OK”.

💡 Pro Tip: Select the table instead of the sheet to confine the data range and detect headers.
Splitting Columns Example:
Split “CityProvince” into “City” and “Province”:

- Select “CityProvince”.
- Click “Transform” -> “Split Column” -> “By Delimiter”.

- Use “ (” as the delimiter (space and open parenthesis) and click “OK”.

We now have the cities and the provinces in separate columns.

- Remove any unwanted characters (e.g., “)“) using “Replace Values”.


- Rename the columns appropriately (double-click on the column header).

Remove unnecessary columns to streamline your Data Model and improve performance:
- Click “Home” -> “Choose Columns”.

- Uncheck unwanted columns and click “OK”.

As with the invoice data, all the applied transformation steps for the customer data have been recorded. They will execute automatically on data refresh.

Final steps
- Rename the query to “MasterCustomer” using “Properties – Name” in the Query Settings pane.

- Click “Close & Apply” to load the results into the Data Model.

- Switch to the Data View to examine the query output.

- Expand titles in the Data pane to see all loaded columns.

- To modify transformations, right-click the query name in the Data pane and select “Edit Query”.

Mastering Power Query is the first step in making the most of Power BI. By following these steps, you can create powerful and insightful dashboards.
Featured Bundle
Power Excel Bundle

Create and Manage Relationships in Power BI
Switch to the Model View in Power BI to visualize the relationships between your tables.

Here’s how to make the most of this feature:
Understanding Table Relationships
In our example, the tables “InvoiceData” and “MasterCustomer” are connected. This connection is established between the “InvoiceData – CustomerCode” column and the “MasterCustomer – CustomerID” column.
- Fact Table: “InvoiceData” is the fact table, which contains records of events or transactions (e.g., sales transactions).
- Lookup Table: “MasterCustomer” is the lookup table, which provides additional details to the fact table (e.g., customer information).
Why Model Relationships Matter:
- Relationships allow real-time lookups between tables.
- No need to merge tables into a single large table.
- Enables efficient data analysis by linking related data points.
For example, you can use a [CustomerCode] from “InvoiceData” to find the corresponding [City] from “MasterCustomer”.
Creating Model Relationships Automatically
Power BI can create relationships automatically. Here’s how to enable or disable this feature:
- Go to File -> Options & Settings -> Options.
- Under Data Load, select Relationships.
- Activate or deactivate automatic relationship creation as needed.

Manual Relationship Creation:
- If automatic relationships aren’t created (common with unstructured data or dissimilar field names), you can manually create them.
- Simply drag a field from one table and drop it onto the corresponding field in another table.
By understanding and utilizing table relationships, you can enhance your Power BI reports, ensuring that your data is connected and ready for insightful analysis.
Building a Report
Creating reports in Power BI is straightforward and intuitive. Here’s how to build your first report:
Report View
Reports are created in the Report View. This is where you can design and customize your visualizations.

Creating Visuals
Select Fields:
- In the Fields pane on the right, check the boxes next to the fields you’re interested in.

- Power BI will automatically create a visualization based on your selected data.

Changing Chart Types:
- You can easily change the chart type. In the Visualizations Library on the right, click on the icon for the desired chart type (e.g., Pie Chart, Line Chart).

Filtering the Data
Filtering data in Power BI allows you to focus on specific aspects of your dataset. Here’s how to filter data using a Slicer visualization:
Switching Chart Types:
- We’ve changed the original Column Chart to a Bar Chart. This chart shows sales for all years.
- To filter sales by specific years, we can add a Slicer in Power BI.

Adding a Slicer:
- Ensure no existing visual is selected in the Report View.
- Click the Slicer icon in the Visualizations Library.

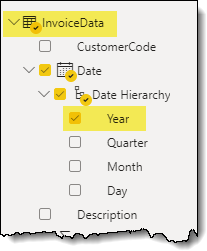
- With the Slicer placeholder selected, click the [Year] field from InvoiceData – Date – Date Hierarchy.

Select Year in the Date Hierarchy.
- Power BI creates a Date Hierarchy to help report data by common periods like quarters or months.

💡 If the Date Hierarchy isn’t created automatically, enable “Auto Date/Time”:
- Go to File -> Options & Settings -> Options -> Data Load -> Time Intelligence -> Auto Date/Time.

Auto date/time in Power BI Options.
Customizing the Power BI Slicer:
- If you prefer a different slicer style, change it in the Format pane.
- Select the slicer visual and go to Format -> Slicer settings -> Options -> Style.

Slicer Styles:
- Vertical List: Displays years in a vertical list.

- Drop Down: Shows a dropdown menu for selecting years.

- Tile: Provides clickable buttons for each year

Using slicers, you can easily filter your data and focus on the information that matters most. This enhances the interactivity and usability of your Power BI reports.
Formatting the Visuals
To format visual elements in Power BI, follow these steps:
Access the Format Pane:
- Click the Paintbrush icon on the Visualizations pane.

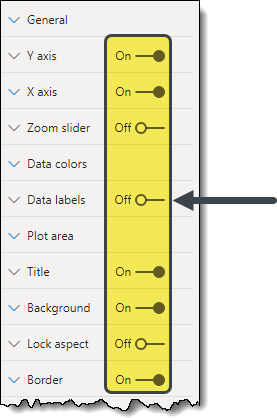
Customize Visuals:
- The options vary based on the visual type.
- Expand a feature to see customization controls.
- Use On/Off toggles to enable or disable features.

Example Customizations:
- Turn Off Axis Titles: Turn off titles for both the Y and X axes.
- Change Bar Color: Set the bar color to orange.

- Edit Chart Title: Change the title of your Bar Chart to “Sales by Category.”
💡 Find the Title option under General formatting properties.

Tooltips
Tooltips in Power BI provide detailed information when you hover over data elements. Here’s how to use them:
Basic Tooltips:
- Tooltips show details like category names and aggregation values.
- They appear when you hover the mouse over a visual’s data element.

Custom Tooltips:
- You can customize tooltips to show additional information.
- Tooltips can even display mini charts filtered by the data point you hover over.

Why Use Tooltips:
- Enhanced Readability: Formatting helps make your visuals more readable and attractive.
- Detailed Insights: Tooltips provide extra information without cluttering the visual.
- Customization: Tailor your visuals to match your specific needs and preferences.
By using these formatting options, you can create clear and informative visuals that enhance your Power BI reports.
Building a Table of Calculations
Creating a table with key calculations in Power BI is simple and doesn’t require writing complex formulas. Here’s how to do it:
Adding a Table Visual
- Click Table in the Visualizations pane to add a table visual to your report.

Select Fields:
- Check the [Month] field in the Date Hierarchy.
- Check the [Sales] field from the “InvoiceData” table.
- Power BI will automatically summarize the sales values, similar to an Excel Pivot Table.

Comparing Sales of Same Month to Previous Year
Click Quick Measure on the Home ribbon.

In the Quick Measures dialog box, set the following:
- Calculation: Year-over-year change
- Base Value: Sum of Sales
- Date: Date

This calculation will show the YOY percentage change in sales for each month compared to the previous year.

Calculating Sales Year-to-Date
Click Quick Measure on the Home ribbon.
In the Quick Measures dialog box, set the following:
- Calculation: Year-to-date total
- Base Value: Sum of Sales
- Date: Date

This will display the total sales year-to-date.

Understanding Data Analysis Expressions (DAX)
What you’ve done is create DAX measures without writing a single formula. DAX, or Data Analysis Expressions, is the formula language in Power BI and Excel’s Power Pivot. It handles all calculations behind the scenes whenever you add a value field to a visual or use Quick Measures, which are pre-made formula templates.
Why It’s Useful:
- Time-Saving: Quick Measures save time by providing ready-made calculations.
- Ease of Use: You don’t need to learn DAX to perform advanced calculations.
- Powerful Analytics: DAX enables complex data analysis and insights.
By using these steps, you can easily build a table of calculations in Power BI, making your data analysis more powerful and efficient.
Featured Course
Excel Data Modeling with Power Pivot & DAX

Adding More Visuals and Exploring Interactions
Enhancing your Power BI report with more visuals and understanding their interactions can provide deeper insights. Here’s how to do it:
Visualizing Sales by Province
Add a Filled Map Chart:
- Select Filled Map in the Visualizations pane.

- Check the [Sales] field from the “InvoiceData” table.
- Check the [Province] field from the “MasterCustomer” table.

Understanding Filtering with Visuals
One of the powerful features of Power BI is that almost every visual can act as a filter. This is known as cross-filtering.
Cross-Filtering Example:
- Click on the bar for “Supermarket” in the Bar Chart.
- All calculations in the table will update to show values for “Supermarket.”
- The Filled Map chart will also update to show only provinces where “Supermarket” sales occurred.

💡 To remove a filter, click the same item again to toggle off the filter or click any empty area of the visual.
Displaying Quantity by Month in a Line Chart
Add a Line Chart:
- Select Line Chart in the Visualizations pane.

- Check the [Month] field in the Date Hierarchy.
- Check the [Quantity] field from the “InvoiceData” table.

Why It’s Useful:
- Interactive Insights: Cross-filtering allows you to see how different data points relate to each other.
- Dynamic Analysis: Visuals automatically update to reflect filtered data, providing dynamic and real-time analysis.
- Clear Data Representation: Different chart types help in representing data clearly and making comparisons easier.
By adding and interacting with these visuals, you can create a comprehensive and interactive Power BI report that provides meaningful insights.
Finishing Touches
Adding the final touches to your Power BI report can make it more professional and informative. Here’s how to do it:
Adding a Report Title
A clear title helps in identifying the purpose of the report. It makes the report easier to understand at a glance.
- Click the Text Box feature on the Home ribbon.

- Enter your desired report title and format it as needed.

Adding KPIs (Key Performance Indicators)
KPIs highlight critical data points. They provide a snapshot of important values.
- Select the Card visual from the Visualizations pane.

- Set the analysis field to [Quantity] to track the total quantity sold.

Rename the Report
- Double-click the page tab at the bottom.
- Change the name from “Page 1” to “Report.”

- Click File -> Save As.
- Choose a descriptive name for your report and save it.
By adding these finishing touches, your Power BI report will be polished, professional, and ready to share.
Publish Reports with Power BI Service
Publishing your Power BI report allows you to share it interactively with others.
Advantages of Using Power BI Service
- Easy Sharing: You only need to send a link to the report, not the Power BI file itself.
- Automatic Updates: When you update the report, viewers see the latest version without needing a new file or link.
How to Publish a Power BI Report
- Click Publish in the upper-right corner of the Home ribbon.

- Select your desired workspace in your Power BI Service account. For free accounts, choose “My workspace”.

- Once the upload is complete, you’ll receive a notification that the report has been successfully published.
View the Report:
- Click the provided link to view the published report in a web browser.
- This allows you to see what the viewers will see and check for any issues.


Sharing the Report with Others
Share via Web Link:
- Click the Share button at the top of the window.
- In the sharing dialog box, enter the email address of the person you wish to share the report with, or copy the link to use in an email or instant message.

Additional Sharing Options:
- Start a new email message using Outlook or share the report via Microsoft Teams.
- Embed the interactive report in a PowerPoint presentation.

By publishing and sharing your Power BI reports, you can collaborate more effectively and ensure your team always has access to the latest data insights.
Explore more amazing features of Power BI with our tutorials, or check out this FREE Power BI Quick Start Course.
Download the Practice Files
Enhance your learning experience by downloading our practice files. Follow the techniques discussed in real-time and learn Power BI with our hands-on examples. Download the practice files here and start applying what you’ve learned directly in Power BI.
Featured Bundle
Black Belt Excel Bundle


Leila Gharani
I’ve spent over 20 years helping businesses use data to improve their results. I've worked as an economist and a consultant. I spent 12 years in corporate roles across finance, operations, and IT—managing SAP and Oracle projects.
As a 7-time Microsoft MVP, I have deep knowledge of tools like Excel and Power BI.
I love making complex tech topics easy to understand. There’s nothing better than helping someone realize they can do it themselves. I’m always learning new things too and finding better ways to help others succeed.


